Estimating Turnout for the Primary
As I did in 2010, I’m going to take a shot at estimating the turnout in the primary election tomorrow. But first, a little tour through Minnesota primary election turnout history.
The History
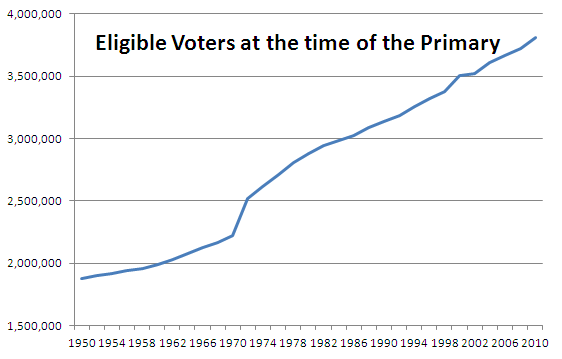
Let’s start with the growth in the number of eligible voters over the years.

This is pretty much a straight line although there are a few interruptions. The big one is between the 1970 and 1972 elections, which makes sense because in 1971 the 26th amendment to the Constitution was ratified, establishing 18 as the official voting age.
There was a little bump up between 1998 and 2000, but that leveled off between 2000 and 2002, such that the trend line is unaffected.
Otherwise, there is a pretty consistent 2% increase in eligible voters from cycle to cycle.

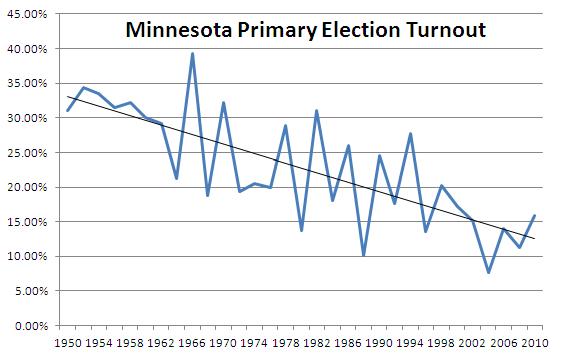
Turnout though, as a percentage of eligible voters, has been falling at about the same rate as the number of eligible voters has been increasing. Although, unlike with the rise in eligible voters, the fall in turnout percentage is happening in a rather volatile manner.
This makes sense though, the factors that drive the growth in eligible voters are not subject to dramatic year to year changes. The factors that drive primary turnout though, mainly the number of competitive races, certainly fluctuate from cycle to cycle.

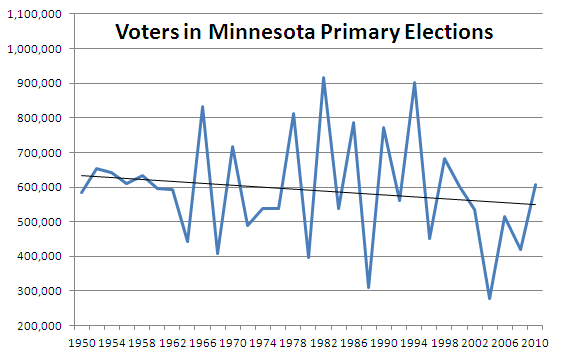
The net result is that in 2010 there were roughly the same number of voters in the primary as there were in 1950, even though there are now significantly more eligible voters.
Estimating Turnout
With the history out of the way, we can get to estimating turnout this year. To do this we need two things, an estimate of the number of eligible voters, and an estimate of a turnout percentage for those eligible voters.
The first part is easy, the second is a little more tricky.
To estimate the number of eligible voters, we just take the number of eligible voters in 2010 and add 2%. In 2010 there were 3,806,763 eligible voters, and adding 2% to that gives us 3,884,596.
Now to figure out a turnout estimate. To do this I like to find a year with similar circumstances, and use the turnout percentage in that year as a proxy.
But as you can see from looking at the graph of turnout over the years, you don’t want to go back too far looking for comparables as the context gets different the farther back you go.
If we go through some recent years; 2010 is out as there was a competitive top of the ticket race. 2008 is a decent comparable, as is 2006. 2004 had nothing going on, no competitive statewide or congressional races to speak of, so that doesn’t work.
So I’m going to use the average turnout between the years 2008 and 2006 as a proxy, since they are both sort of comparable. In 2008 turnout was 11.25% and in 2006 it was 14%. The average of these two is 12.625%, but I’m just going to use 12.5%.
That gives us a turnout prediction of: 485,575.
Below is a table with estimates based on different turnout assumptions.
Thanks for your feedback. If we like what you have to say, it may appear in a future post of reader reactions.


