

The polls win
This is just a short decompression post. I will have more detail on many of these points in the future.
Going into yesterday I had high hopes. That’s just an expression actually because hope isn’t the right word to describe it, based on all the evidence it looked like it was going to be a good night for Democrats, at least in Minnesota if not nationally.
And it was. And while everything went the way I expected it to, that’s one of the things that makes elections so exciting, is finding out whether your data is any good. In this case, as in pretty much all past cases, the data was solid and the polls correctly foretold the story, no unskewing necessary.
The Presidential race between President Barack Obama and Mitt Romney, while seemingly going through some ups and downs, nonetheless ended up right where it started. Same could be said for the Minnesota Senate race between Senator Amy Klobuchar and State Rep. Kurt Bills, except that Klobuchar was pulling away at the end.
The polls got the Presidential race correct and they got the Minnesota Senate race correct.
All of the Minnesota Congressional races, except for the sixth district, went in a predictable fashion, again, their outcomes predicted by the available public polls. Even in the sixth district race between Representative Michele Bachmann and Jim Graves there were polls showing a tight contest (Jim Graves internal polls).
The polling of the Minnesota Legislative generic ballot also did a really good job of predicting the final distribution of seats in the two chambers of the Minnesota Legislature. The final polling average had the DFL with a seven point advantage in the generic ballot. Using the regression line from the post linked above, this would predict a legislative seat distribution of 41-26 in the Senate and 77-57 in the House. The actual results (as of now) 39-28 Senate, 73-61 House.
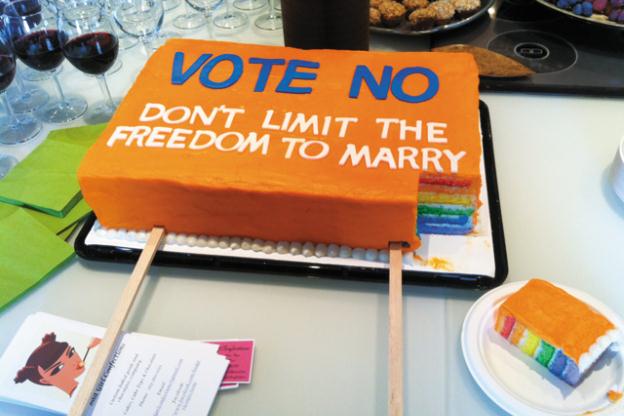
The final Marriage amendment polling average was: No 49%, Yes 46%. Almost final results: No 51%, Yes 48%.
There was an exception to all of this though. And since it’s the one thing I have yet to mention I’m sure you know already what it is. The final polling average of the Photo Voter ID amendment was: No 45%, Yes 50%. Almost final results: No 52%, Yes 46%.
It helps some if you just look at the last three polls, then the polling average would be: No 48%, Yes 48%. And if you look at only the last two polls the polling average becomes pretty accurate. And I probably don’t have to point this out, but two polls is not a lot of polls.
It’s hard to know for sure, but it certainly seems like we have a (former?) Republican to thank for Photo Voter ID losing. So once again, thank you Governor Arne Carlson!
Thanks for your feedback. If we like what you have to say, it may appear in a future post of reader reactions.