Minnesota Generic Legislative ballot shows big DFL advantage
On Tuesday of last week I looked at the Constitutional Amendment portion of the recent Public Policy Polling poll of Minnesota. Then on Wednesday I looked at the horse race portion as it concerns statewide elected officials, both those running for office this year and those who will likely run for re-election in 2014. Then a bunch of Eighth Congressional district polls came out and I looked at those too.
What I have failed to cover, till this very moment that is, are the numbers that PPP had on their generic legislative ballot test. Those numbers painted a very rosy picture for the Democratic-Farmer-Labor party.
PPP (10/8, 9/12 in parenthesis, 6/4 in brackets):
If there was an election for the legislature today, do you think you would vote for the DFL or Republican candidate from your district?
DFL 52 (47) [48]
Republican 40 (44) [36]
Not sure 8 (9) [16]
(MoE: ±3.4%)
This is pretty significant movement since PPP’s last asking of this question, but it’s also, by a rather significant amount, the best topline number for the DFL that we’ve seen all year, by any pollster. By a lot.
In the previous four polls, two by PPP and two by SurveyUSA, support for the DFL candidate has ranged from 45%-48%. On the other side the 40% support for the GOP candidate is right where the average of the previous four polls has them.
Looking at the cross tabs this entire shift in the numbers between this poll and the previous one can be attributed to two things; the change in the partisan mix of the respondents, and movement among independents.
The previous poll which showed a three point DFL advantage broke down as 35D/32R/33I, while this one broke down as 38D/29R/32I. That’s three points more Democratic and three points less Republican. That accounts for six points of the nine point shift.
The other three points is from independents moving to the DFL, having gone from dividing their support equally between the two parties, 39-39, to supporting the DFL by 14 points, 48-34.
While its a bad idea to read too much into sub-samples of samples, if the GOP is losing independents by 14 points, they are in big trouble.
In a previous post I published the following table:
This table shows all of the legislative elections this decade, along with the total numbers of votes for each party and the resulting number of seats that party controlled in the proceeding legislative session. I’d like to explore these numbers a little further, and so have made a couple of graphs.
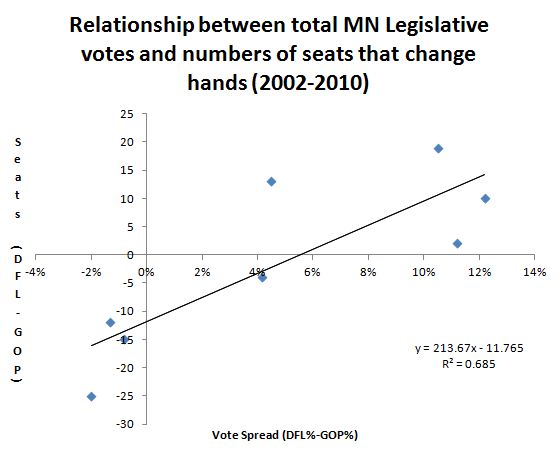
The first is a scatter plot of the “Spread” and “Result” columns from the above table.

As you can see, there is a pretty clear relationship between the amount of total votes a party receives for the legislature and how many seats they flip. But there are a few notable outliers, the 2004 house election and the 2008 house election being the most obvious cases.
In 2004 the DFL got 5% more of the vote than the GOP and won 13 seats. In 2008 the DFL got 11% more of the vote than the GOP and won 2 seats.
There is an obvious reason for this of course, the context of those elections. In the 2004 election, the GOP had a 28 seat advantage in the house. This means that just getting back to a 50-50 split involved the DFL picking up a bunch of seats.
Likewise in 2008, even though the DFL had an 11% advantage they only picked up two seats because they had already won pretty much all the seats they could conceivably win in 2006.
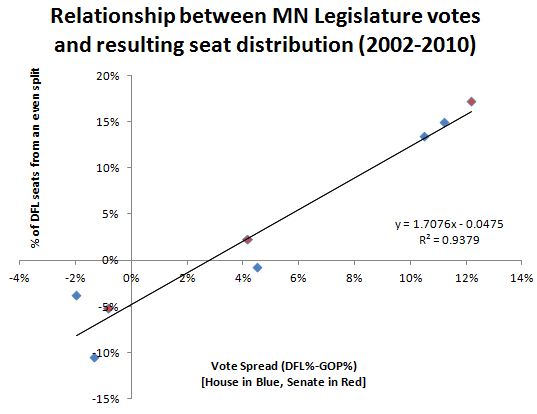
A better way to look at these numbers is to compare the “Spread” column to the resulting distribution of legislative seats. The following graph is such a comparison, where the y-axis is the percentage of seats the DFL is away from 50%.

This is a much better correlation than the first graph, as you can see by the R² numbers. As R² is on a scale of 0 to 1, .94 indicates a very strong relationship.
This isn’t something that should really come as earth shattering news. It’s not hard to deduce that the party that wins more votes will usually win more seats. It’s still nice to see, with your own two eyes, how strong this relationship really is though and it’s really strong. Also, the regression line formula will allow predictions to be made!
The regression line crosses the x axis at just about 3% (2.73%). The implication of this is that if the DFL gets 3% more of the statewide legislative votes we would expect that to result in a roughly even distribution of legislative seats between the two parties.
A 3% advantage is the smallest advantage that the DFL has had in the polling so far though. They have also had advantages of 5, 7, 12 and 12. If you average them all out you get a seven point DFL advantage.
According to the above regression line a seven point DFL advantage at the ballot box would lead to them taking over both houses of the legislature and it wouldn’t be close. A seven point edge in the overall votes would suggest a distribution of 77-57 in the house and 41-26 in the Senate.
The following table breaks down different scenarios that could occur, from the DFL and the GOP getting the same number of votes, that would be a 0% difference, and going up in irregular intervals to a 12% DFL advantage.
The resulting distribution of House and Senate seats are predicted by the regression line from the graph above (y=1.706x-0.0475).
| House DFL | House GOP | Senate DFL | Senate GOP | |
| 0% | 61 | 73 | 29 | 38 |
| 3% | 67 | 67 | 34 | 33 |
| 5% | 72 | 62 | 37 | 30 |
| 7% | 77 | 57 | 41 | 26 |
| 10% | 84 | 50 | 46 | 21 |
| 12% | 88 | 46 | 49 | 18 |
One thing to keep in mind is that all of this data is based on the old legislative district lines, so there exists a possibility that these new lines will shake up this trend.
Considering the least change nature of the map that came out, I don’t think it will make much of a difference when looking at things from a macro level like this.
Be that as it may, if a 3% edge means two coin flips for control, and 3% is the DFLs floor right now, things don’t look good for continued Republican control of either chamber of the Minnesota Legislature.
If you’ve made it this far into the post, I’ve now broken the 1,000 word barrier, not that anyone’s counting, then you’re probably the type of person who would like to come to a very special Drinking Liberally Presidential debate watching party at the Amsterdam Bar and Hall in St. Paul, starting at 7pm.
At around 7:30pm will be some remarks by Carrie Lucking of the Alliance for a Better Minnesota and the A Better Legislature campaign.
Followed by the debate at 8pm.
Thanks for your feedback. If we like what you have to say, it may appear in a future post of reader reactions.


