

Ideology Scores for State Legislatures
If you are unfamiliar with it, DW-Nominate is a way of classifying United States Congress people based on how they vote. It rates them on a liberal to conservative scale, with -1 representing a very liberal congressperson and 1 representing a very conservative congressperson.
In the past I’ve used this very helpful tool to examine the ideological differences in Minnesota’s Congressional delegation and even used it to create a neat little metric that combined DW-Nominate with PVI.
DW-Nominate measures a Congressperson’s ideological tendencies when voting on legislation. PVI measures a Congressional district’s ideological tendencies when voting for President. When used together, DW-Nominate and PVI can help answer questions like, to what degree can a legislator’s voting ideology be predicted by their districts partisan lean? You know, fun questions!
Until recently there weren’t any publicly available metrics that do for state-level legislatures what DW-Nominate does for the nation’s legislature. Courtesy of Measuring American Legislatures, now there is.
Before getting into the individual legislator level data, I want to use this post to look at the macro-level, state-by-state comparisons. What follows are a couple of charts provided by the creators of this metric, called “np_score”.
The first chart concerns the relative polarization of each state, I’ve highlighted Minnesota in blue.
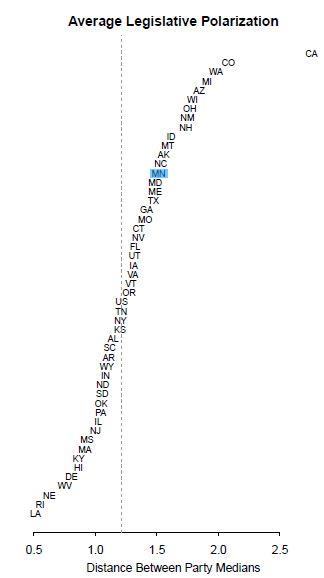
The take-away from this graph is that when it comes to Legislative polarization, there is California, and there is everyone else. To illustrate, the difference between California and Colorado, first and second in distance between party means, is the same as the difference between Michigan, forth place, and the national average.
California is like the Barry Bonds of Legislative polarization.
The next graph is the comparison of all the state Legislatures, by party, in box plot form. Again, I’ve highlighted Minnesota’s entry in blue.
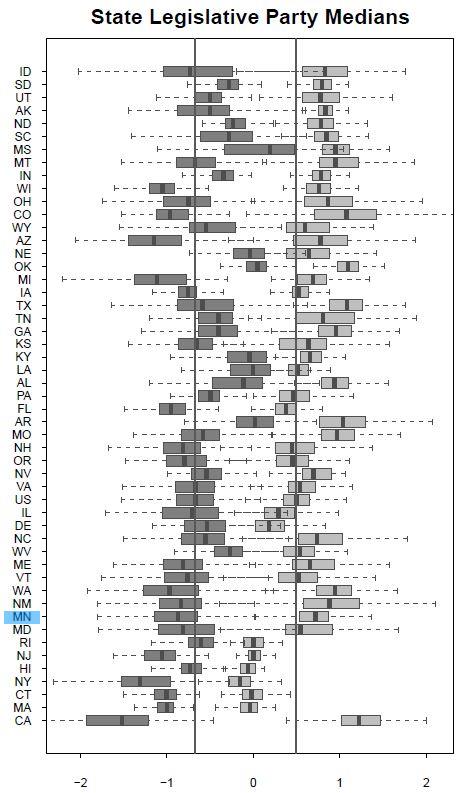
Both political parties in Minnesota are, on average, more ideological than the norm, and both by about the same amount. Not only that, the great majority of both parties members are more ideological in their voting than the norm, leaving a big gap in the middle, filled only with the centrist fringes of the two parties.
That gap in the middle becomes even more obvious when we compare individual Minnesota legislators np_scores to hPVI, as I have done in the following scatter plot.
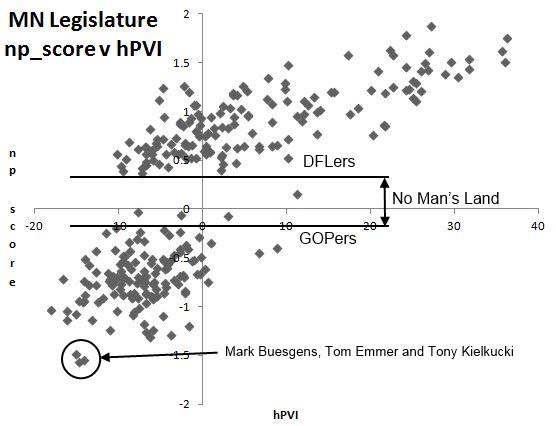
You can see a few things rather clearly in this graph; as mentioned above, there is a vast gulf between the two parties that encompasses the center of the ideological spectrum. Also you can see the differences in how the two parties members are distributed. The DFL’s ideology scores have a much stronger linear relationship with hPVI then the GOP’s scores do.
The DFL’s scatter plot forms a gradual ramp of data points. The GOP’s scatter plot forms a random blob of data points.
This aspect of np_score, the differences in how it relates to hPVI between the two parties, will be discussed in much greater depth in the next post in this series.
Thanks for your feedback. If we like what you have to say, it may appear in a future post of reader reactions.