hPVI, and what it says about the Senate
This was in response to my posting of the Minnesota Senate hPVI numbers yesterday:
This shows GOP keeping MN Sen RT @eric_pusey: Check this out! RT @tonyangelo: Minnesota Senate hPVI ow.ly/1kGFkC #stribpol #mnleg
— Bill Walsh (@billtwalsh) June 19, 2012
The short response (it’s twitter, there are no other kinds of responses I suppose) that I provided to that is as follows:
@billtwalsh Not necessarily, DFLers historically do better in marginal districts.
— Tony Petrangelo (@TonyAngelo) June 19, 2012
That answer suffered from the problem of not being very detailed though, so that is what I will do within the confines of this post, go into detail.
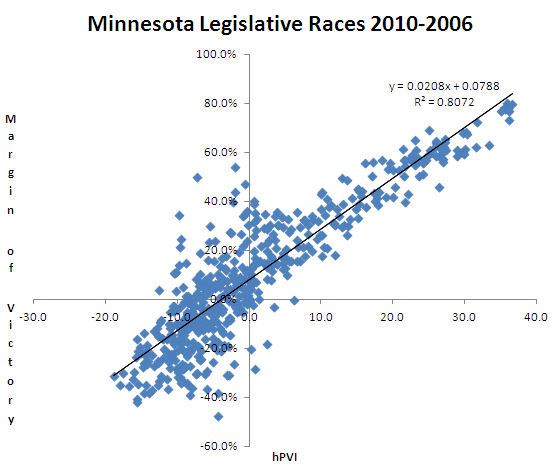
That detail is best illustrated with a graph (for that matter, what point isn’t well served by being graphed)!

What you’re looking at is a scatter plot of every legislative election from 2006-2010 (with the exception of races with only one candidate). The vertical axis is the election margin (positive for a DFL victory), the horizontal axis represents the corresponding districts hPVI (the districts hPVI at the time of the election, not current hPVI. This is why I only went back to 2006, because compiling hPVI data for 2004, with redistricting having happened in 2002, was not practical).
If one was to separate the graph into quadrants, the top left quadrant would represent Democrats who won election in GOP leaning districts. While the bottom right quadrant represents GOPers who have won election in districts that lean Democratic.
Looking at the scatter plot it should be pretty obvious which quadrant has more little dots. You might be surprised just how many little dots are in the top left quadrant though, 100.
DFL candidates have won 100 elections for the legislature in GOP leaning districts over the last three cycles while the GOP has won just eight such races in DFL leaning districts.
But that comparison is a little bit unfair to the GOP since 2006 and 2008 were DFL wave years while the GOP only had a wave in 2010. So if we were to just compare 2006 to 2010 (because there were state senate elections in both of those years), the picture doesn’t get any better for the GOP.
In those two elections DFLers won 65 races in GOP leaning seats while the GOP won eight in DFL districts. That is the point I was making with my response to Bill Walsh that I posted above. DFLers win in Republican leaning seats all the time, Republicans rarely win in DFL seats though.
The above scatter plot contains a formula for the regression line that runs through it. If we work that formula backwards, solving for a 0% margin of victory, we get R+3.8 (or -3.8) as the answer.
What this means is that we would expect a district with an R+3.8 lean to result in a tied election and anything greater than that would be a GOP victory, anything less, a DFL victory. Meaning a pure toss-up district is between R+3 and R+4.
If we were to use the regression formula to estimate Ted Daley’s margin of victory, as an example, we see that, despite his being in an R+1 district and all other thing’s being equal, he’s expected to lose by almost six points.
With that in mind, let’s again look upon the list of most vulnerable Republicans.
Candidate (Senate district | hPVI)
Jermey Miller (28 | D+1)
John Carlson (5 | EVEN)
April King (42 | EVEN)
Ted Daley (51 | R+1)
Keith Downey (49 | R+2)
John Pederson (14 | R+2)
Ted Lillie (53 | R+3)
Pam Wolf (37 | R+3)
Joe Gimse (17 | R+4)
Benjamin Kruse (36 | R+4)
If we just went by what we learned about hPVI above, we would actually expect the first six names on the list to lose. If that happened and the DFL held all of its current seats, then the race in SD53, the next one on the list, would decide control of the Senate.
In other words, hPVI sees the Senate as pretty much a pure toss-up.
Thanks for your feedback. If we like what you have to say, it may appear in a future post of reader reactions.


