


hPVI 2019, Senate edition
It’s time for the bi-annual release of hPVI, Minnesota’s Oldest And Most Beloved Legislative District Metric™.
For those unfamiliar with hPVI, it’s a partisan voting index for state legislative districts that I’ve been compiling in one form or another for over nine (!) years; where have you been?
In what follows there will be a graph and some tables and I’ll do some analysis, the actual hPVIs can be found at the bottom of the post for those who don’t want any context.
For more information on what hPVI is see the explainer (from the 2017 edition, but still relevant as an explainer). For programmatic access to the numbers see the hPVI API. There is also an hPVI LeftMN sub-site now which can be found at hpvi.left.mn.
Senate hPVI Histogram
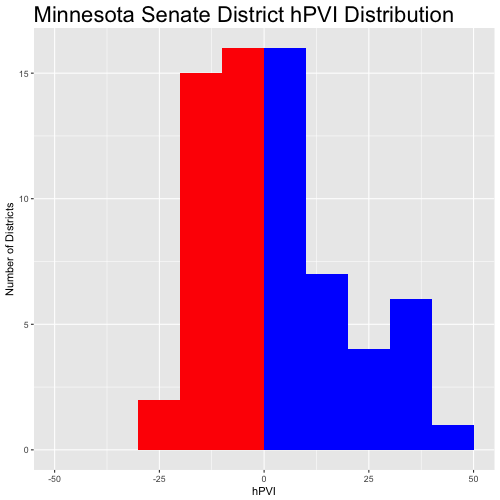
If you’re unfamiliar with histograms, the bars are buckets of districts, each bucket being 10 hPVI wide. Meaning one bucket contains all the Even to D+10 districts, one bucket contains all the D+11 to D+20 districts, one bucket contains all the D+21 to D+30 districts and on and on. The height of the bars is represents the number of districts in each bucket.
Right now there are exactly as many Even to D+10 districts as Even to R+10 districts, a more than modest departure from the last iteration of hPVI. In the 2017 version there were 21 Even to R+10 districts and 15 Even to D+10 districts.
Looking at the next set of buckets, there were 16 R+11 to R+20 districts in 2017 there are 15 now and there were only five D+11 to D+20 districts in 2017 there are seven now. Additionally, there are two seats over R+20 this iteration, there were none last time.
Because describing what is essentially a table of information with words is not the most exciting use of words, here’s how the two versions compare in their proper table form:
| Year | > R+20 | R+20 – R+11 | R+10 – Even | Even – D+10 | D+11 – D+20 | > D+20 | Total GOP | Total DFL |
|---|---|---|---|---|---|---|---|---|
| 2019 | 2 | 15 | 16 | 16 | 7 | 11 | 33 | 34 |
| 2017 | 0 | 16 | 21 | 15 | 5 | 10 | 37 | 30 |
Heading into 2020 three seats moved into the “safe” column for the DFL (districts greater than D+10) while the GOP added a single district in this category. Likely of more consequence, one district got added to the “marginal” DFL column (Even – D+10) while the GOP lost five districts from that column.
The aggregate results show that the Senate is very much in play in 2020, with more districts now favoring the DFL than the GOP.
Before we further break down which districts are actually in play, let’s look at what different hPVI advantages mean in terms of likelihood of the party with that advantage winning the district. As an example, Senator Scott Jensen’s SD47 has an hPVI of R+7. This means that the Republicans have a roughly 90% chance of holding onto that district in the 2020 election.
| hPVI Edge | Win Probability |
|---|---|
| 12 | 99% |
| 10 | 97% |
| 7 | 90% |
| 5 | 80% |
| 3 | 70% |
| 2 | 65% |
| 1 | 55% |
A popular method for rating a political districts likelihood of being won by one party or another is to label the district as Toss-up, Lean, Likely, or Safe. Using the above table as reference we can create such labels for each district.
I’ve defined these labels for hPVI as: an hPVI of greater than 10, which translates to at least a 97% chance of victory, is classified as safe, a district with an hPVI between ten and five, at least an 80% chance of victory, is likely, five to two is lean and two and less toss-up.
Using that classification method here’s how the districts are distributed.
| Safe GOP | Likely GOP | Lean GOP | Toss-up | Lean DFL | Likely DFL | Safe DFL |
|---|---|---|---|---|---|---|
| 17 | 7 | 4 | 8 | 7 | 6 | 18 |
| 28 | 8 | 31 | ||||
Those eight Toss-up districts will be some of the most contested Senate districts next year, they are:
| District | Name | Party | hPVI |
|---|---|---|---|
| 4 | Kent Eken | DFL | R+1 |
| 14 | Jerry Relph | R | R+1 |
| 25 | David Senjem | R | D+1 |
| 28 | Jeremy Miller | R | EVEN |
| 34 | Warren Limmer | R | R+1 |
| 37 | Jerry Newton | DFL | D+1 |
| 38 | Roger Chamberlain | R | R+1 |
| 39 | Karin Housley | R | R+1 |
Also, there are five Senators that sit in districts classified as leaning (or greater) to the party they are not in, and I would be surprised if these aren’t the five most targeted districts in the state:
| District | Name | Party | hPVI |
|---|---|---|---|
| 26 | Carla Nelson | R | D+2 |
| 27 | Dan Sparks | DFL | R+3 |
| 44 | Paul Anderson | R | D+10 |
| 56 | Dan Hall | R | D+3 |
| 58 | Matt Little | DFL | R+6 |
Senate hPVI Table Analysis
This edition marked a continuation of trends from the last edition. In the last edition greater Minnesota, specifically many of the Iron range districts, had significant movement towards the GOP. While those trends largely continued in this edition, they were less pronounced.
(As an aside and to point out how prescient I am, one of the districts that I highlighted in the 2017 edition as having made significant movement toward the GOP, district 11, has since been won by the GOP in a special election to replace someone who is no longer serving in the job he got appointed to. I fully expect the Walz administration to run future appointments of Senators and Legislators by me to make sure a fiasco like this doesn’t happen again.)
Likewise in the last edition suburban Minnesota had some modest movement towards the DFL, that trend continued in this edition. There are now eight Republican Senators who sit in districts with an hPVI of R+1 or less and of those four are in districts that are actually Democratic leaning, including Paul “Lock Of The Cycle To Lose His Seat” Anderson’s SD44 at D+10(!)!
Here’s a fun fact, Dan Hall’s SD56 is now as Democratic leaning as David Tomassoni’s SD6.
Greater Minnesota District Movement
SD1 (Mark Johnson) R+10 to R+14, a 4 point swing (11 points since 2015).
SD2 (Paul Utke) R+10 to R+13, a 3 point swing (9 points since 2015).
SD3 (Tom Bakk) D+6 to D+4, a 2 point swing (6 points since 2015).
SD5 (Justin Eichorn) R+3 to R+5, a 2 point swing (8 points since 2015).
SD6 (David Tomassoni) D+7 to D+3, a 4 point swing (12 points since 2015).
SD9 (Paul Gazelka) R+18 to R+22, a 4 point swing (12 points since 2015).
SD10 (Carrie Ruud) R+10 to R+13, a 3 point swing (8 points since 2015).
SD11 (Jason Rarick) Even to R+3, a 3 point swing (9 points since 2015).
SD12 (Torrey Westrom) R+12 to R+16, a 4 point swing (10 points since 2015).
Suburban Minnesota District Movement
SD34 (Warren Limmer) R+5 to R+1, a 4 point swing (6 points since 2015).
SD38 (Roger Chamberlain) R+4 to R+1, a 3 point swing (4 points since 2015).
SD42 (Jason Isaacson) D+7 to D+10, a 3 point swing (5 points since 2015).
SD44 (Paul Anderson) D+5 to D+10, a 5 point swing (9 points since 2015).
SD47 (Scott Jensen) R+11 to R+7, a 4 point swing (5 points since 2015).
SD48 (Steve Cwodzinski) D+4 to D+9, a 5 point swing (9 points since 2015).
SD49 (Melisa Franzen) D+8 to D+12, a 4 point swing (9 points since 2015).
SD51 (Jim Carlson) D+6 to D+10, a 4 point swing (6 points since 2015).
SD53 (Susan Kent) D+4 to D+8, a 4 point swing (7 points since 2015).
SD56 (Dan D. Hall) R+1 to D+3, a 4 point swing (5 points since 2015).
The Senate hPVI Table
rPVI = raw hPVI, abs = absolute value
| District | Name | Party | hPVI | rPVI | abs |
|---|---|---|---|---|---|
| 01 | Mark Johnson | R | R+14 | -14.42 | 14.42 |
| 02 | Paul J. Utke | R | R+13 | -12.86 | 12.86 |
| 03 | Thomas M. Bakk | DFL | D+4 | 3.68 | 3.68 |
| 04 | Kent Eken | DFL | R+1 | -1.25 | 1.25 |
| 05 | Justin D. Eichorn | R | R+5 | -5.46 | 5.46 |
| 06 | David J. Tomassoni | DFL | D+3 | 2.82 | 2.82 |
| 07 | Erik Simonson | DFL | D+19 | 19.41 | 19.41 |
| 08 | Bill Ingebrigtsen | R | R+15 | -15.33 | 15.33 |
| 09 | Paul E. Gazelka | R | R+22 | -22.50 | 22.50 |
| 10 | Carrie Ruud | R | R+13 | -13.07 | 13.07 |
| 11 | Jason Rarick | R | R+3 | -3.32 | 3.32 |
| 12 | Torrey N. Westrom | R | R+16 | -15.83 | 15.83 |
| 13 | Jeff Howe | R | R+15 | -14.61 | 14.61 |
| 14 | Jerry Relph | R | R+1 | -1.21 | 1.21 |
| 15 | Andrew Mathews | R | R+20 | -20.23 | 20.23 |
| 16 | Gary H. Dahms | R | R+13 | -13.25 | 13.25 |
| 17 | Andrew R. Lang | R | R+12 | -11.53 | 11.53 |
| 18 | Scott J. Newman | R | R+18 | -17.69 | 17.69 |
| 19 | Nick A. Frentz | DFL | D+7 | 6.70 | 6.70 |
| 20 | Rich Draheim | R | R+5 | -4.66 | 4.66 |
| 21 | Michael P. Goggin | R | R+7 | -7.05 | 7.05 |
| 22 | Bill Weber | R | R+14 | -14.32 | 14.32 |
| 23 | Julie A. Rosen | R | R+12 | -11.79 | 11.79 |
| 24 | John R. Jasinski | R | R+9 | -9.23 | 9.23 |
| 25 | David H. Senjem | R | D+1 | 1.31 | 1.31 |
| 26 | Carla J. Nelson | R | D+2 | 2.48 | 2.48 |
| 27 | Dan Sparks | DFL | R+3 | -2.74 | 2.74 |
| 28 | Jeremy R. Miller | R | EVEN | 0.04 | 0.04 |
| 29 | Bruce D. Anderson | R | R+14 | -14.37 | 14.37 |
| 30 | Mary Kiffmeyer | R | R+14 | -14.18 | 14.18 |
| 31 | Michelle R. Benson | R | R+18 | -18.44 | 18.44 |
| 32 | Mark W. Koran | R | R+14 | -13.85 | 13.85 |
| 33 | David J. Osmek | R | R+4 | -4.36 | 4.36 |
| 34 | Warren Limmer | R | R+1 | -0.56 | 0.56 |
| 35 | Jim Abeler | R | R+7 | -6.72 | 6.72 |
| 36 | John A. Hoffman | DFL | D+4 | 4.23 | 4.23 |
| 37 | Jerry Newton | DFL | D+1 | 1.35 | 1.35 |
| 38 | Roger C. Chamberlain | R | R+1 | -1.24 | 1.24 |
| 39 | Karin Housley | R | R+1 | -1.39 | 1.39 |
| 40 | Chris A. Eaton | DFL | D+22 | 21.89 | 21.89 |
| 41 | Carolyn Laine | DFL | D+16 | 16.27 | 16.27 |
| 42 | Jason Isaacson | DFL | D+10 | 10.35 | 10.35 |
| 43 | Charles W. Wiger | DFL | D+9 | 9.40 | 9.40 |
| 44 | Paul T. Anderson | R | D+10 | 9.59 | 9.59 |
| 45 | Ann H. Rest | DFL | D+18 | 17.63 | 17.63 |
| 46 | Ron Latz | DFL | D+24 | 23.65 | 23.65 |
| 47 | Scott M. Jensen | R | R+7 | -7.22 | 7.22 |
| 48 | Steve Cwodzinski | DFL | D+9 | 8.77 | 8.77 |
| 49 | Melisa Franzen | DFL | D+12 | 12.34 | 12.34 |
| 50 | Melissa H. Wiklund | DFL | D+15 | 14.98 | 14.98 |
| 51 | Jim Carlson | DFL | D+10 | 10.37 | 10.37 |
| 52 | Matt D. Klein | DFL | D+9 | 9.26 | 9.26 |
| 53 | Susan Kent | DFL | D+8 | 7.56 | 7.56 |
| 54 | Karla Bigham | DFL | D+2 | 2.00 | 2.00 |
| 55 | Eric R. Pratt | R | R+6 | -5.87 | 5.87 |
| 56 | Dan D. Hall | R | D+3 | 3.30 | 3.30 |
| 57 | Gregory D. Clausen | DFL | D+5 | 4.57 | 4.57 |
| 58 | Matt Little | DFL | R+6 | -6.30 | 6.30 |
| 59 | Bobby Joe Champion | DFL | D+35 | 35.38 | 35.38 |
| 60 | Kari Dziedzic | DFL | D+37 | 36.65 | 36.65 |
| 61 | D. Scott Dibble | DFL | D+37 | 36.65 | 36.65 |
| 62 | Jeff Hayden | DFL | D+43 | 42.62 | 42.62 |
| 63 | Patricia Torres Ray | DFL | D+35 | 34.85 | 34.85 |
| 64 | Richard Cohen | DFL | D+33 | 32.64 | 32.64 |
| 65 | Sandra L. Pappas | DFL | D+34 | 34.19 | 34.19 |
| 66 | John Marty | DFL | D+28 | 27.88 | 27.88 |
| 67 | Foung Hawj | DFL | D+27 | 27.28 | 27.28 |
Thanks for your feedback. If we like what you have to say, it may appear in a future post of reader reactions.