

Partisan ID in polls
Or, how I learned to stop worrying and trust the top lines.
The release, by the StarTribune, of their latest Minnesota Poll sent various bloggers and media types around the state into a “there are too many DFLers in the poll, it’s worthless” tizzy.
They may have a point; a plus thirteen DFL advantage does seem quite high. For comparison let’s look at the partisan breakdown of the three most recent polls done of Minnesota, the Minnesota Poll, conducted by Mason-Dixon, the KSTP poll conducted by SurveyUSA and the Public Policy Polling poll, conducted by, well, Public Policy Polling.
| Pollster | D% | R% | I% | Spread |
| Mason-Dixon | 41 | 28 | 31 | D+13 |
| PPP | 35 | 32 | 33 | D+3 |
| SurveyUSA | 37 | 30 | 27 | D+7 |
The above table would seem to confirm the idea that the partisan ID numbers are not right in the Mason-Dixon poll. But with such big differences between the three polls you would expect that the Presidential numbers would also be quite a bit different, with Obama staked to a much larger lead in the Mason-Dixon poll.
If you thought that though, you would be wrong.
| Pollster | D% | R% | Spread |
| Mason-Dixon | 48 | 40 | D+8 |
| PPP | 51 | 44 | D+7 |
| SurveyUSA | 50 | 40 | D+10 |
The Mason-Dixon poll, which had the highest proportion of respondents say they were Democrats, nonetheless had the lowest proportion of its respondents say they would vote for the President, who is a Democrat. If the differences in partisan ID in the cross tabs were really driving the numbers as much as some want to think they are, this would show up in the Presidential numbers. The fact that it isn’t should tell you something.
That something that it should tell you is that finding “error” in the cross tabs of a poll is usually a fool’s errand. In any one poll it’s pretty easy to find weird looking crosstabs, but in the end it usually amounts to nothing more than noise.
Unlike things that pollsters should actually control for like age, gender and race, party identification can change as quickly as a person’s underwear.
Let’s look at these numbers another way.
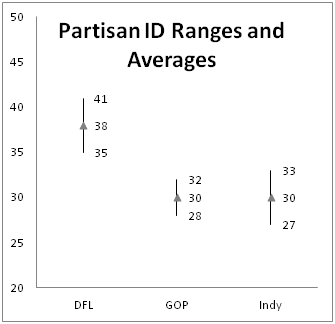
What this chart shows is the high and low as well as the average, for each group. As you can see, all three groups have a spread of about five points from the high to the low, with the averages breaking out as 38/30/30, which is right about where conventional wisdom says the numbers should be.
Gallup, who does regular polling of partisan identification in all the states, had Minnesota at 48% Democratic and 38% Republican in the survey they released in August. But this survey groups those who identify with one party or the other in with those who lean towards one party or the other. Additionally, these Gallup numbers are not of registered or likely voters, but are of all adults.
Nonetheless Gallup’s numbers show a ten point difference in partisan ID between Democrats and Republicans, similar to average spread of the three pollsters in question.
Mason-Dixon’s poll probably included too many Democrats. But on the flip side PPP’s poll probably included too few Democrats, but you don’t hear anyone banging the war drum on that one.
As has been said many times on this blog, and many times on much more reputable blogs, any one single poll is neither infallible nor total garbage. And the only real way to sort through it all is to throw all of the polls together and average them out. In this way polling becomes like a crowd sourcing exercise, with different pollsters contributing their own set of assumptions to the whole body of understanding.
Shouting about screwed up partisan ID numbers and claiming that a poll is nothing but a big media conspiracy to suppress this group of voters or that group of voters is not hard; in fact it’s quite easy. But just because a person shouts something over and over, chants it if you will, doesn’t make it true. It just makes that person who is shouting look foolish.
Thanks for your feedback. If we like what you have to say, it may appear in a future post of reader reactions.