

Looking at some features of the Minnesota Elections Info site
Tuesday I introduced the Minnesota Elections Info site. Today, I’m going to spend a bit of time on some of the features of the site.
There are currently four different sections to the site; General elections results, Primary elections results, a general elections Graph and a timeline of Minnesota electoral history. Let’s go over these different sections.
General and Primary Elections Results
The most basic element of the Minnesota Elections Info site is the actual elections results. Currently the site has General and Primary election data for all statewide non-judicial races, as well as US House and State Legislature races from 2000-2012.
From a single interface you can select a year to view results in and what office to view the results for. If you are looking at the results of an office and you go to a different year, it follows the results of the office you were looking at. So, if you are looking at the election results from Minnesota’s eighth Congressional district in 2012 and then click on 2008, you will go to the elections results of the eighth district race from 2008.
Also, all of the results for elections can be found under a consistent url structure that works as follows:
| Base | Type | Year | Office | District |
|---|---|---|---|---|
| http://elections.left.mn/ | general/ | [2012-2000]/ | president | |
| ussenator1 | ||||
| ussenator2 | ||||
| governor | ||||
| secretaryofstate | ||||
| attorneygeneral | ||||
| primary/ | auditor | |||
| amendment1 | ||||
| amendment2 | ||||
| ushouse/ | [1-8] | |||
| senate/ | [1-67] | |||
| house/ | [1A-67B] |
As an example, the path to the results of the 2012 8th district US House race would be:
http://elections.left.mn/general/2012/ushouse/8
This makes it especially easy to look at the results of different legislative races by just changing the district in the URL.
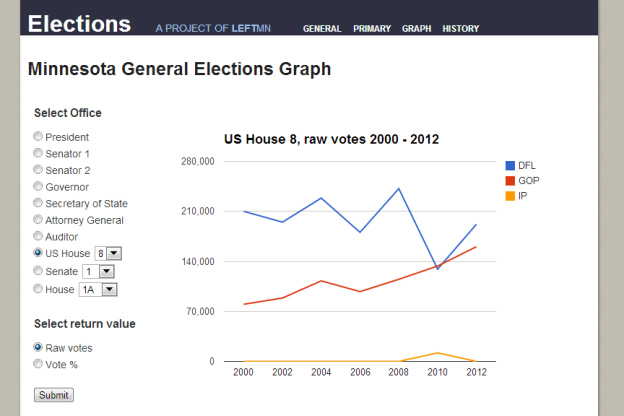
General Elections Graph
Shown in the titular picture of this post, the General elections graph allows you to see the results of elections for an office over the course of time. You can chose to look at the results as a percentage of votes cast or you can see the actual number of votes.
The picture above shows Minnesota’s eighth Congressional district with the results in the form of actual votes. What the graph shows is a slow, but steady rise in the number of votes the Republican candidate has been getting, while at the same time a dramatic increase in the volatility of the DFL’s number of votes.
The mechanics of the page should be straight forward, select an office, select if you want to see actual votes or vote percentage and hit submit. Internet magic does the rest.
Elections History Timeline
If you prefer to see the results in a different way, there’s a visual timeline of Minnesota’s electoral history going all the way back to the state’s founding in 1858. You can see the decades upon decades of Republican domination of the state into the 1920s, followed by the rise of the Farmer-Labor party, which was then followed by the rise of the Democratic-Farmer-Labor party, which leads into our modern times.
More Stuff
We’re not finished though. New features will continue to be added to the site as they are ready. In the meantime, you can let us know what you think in the comments here on the website, or you can leave feedback at: http://elections.left.mn/feedback
Thanks for your feedback. If we like what you have to say, it may appear in a future post of reader reactions.