


2015 Minnesota hPVI
I published the first edition of hPVI, my first foray into political metrics, almost five years ago. What you’re looking at now is the forth edition of hPVI, or more properly, the 2015 edition of hPVI.
“What is hPVI?” is a question that someone who read the previous sentences might be thinking. hPVI is a Partisan Voting Index designed for state (Minnesota in particular) legislative districts. While this is only the fourth edition of hPVI, Partisan Voting Index (PVI), has been around for awhile. From the lazy blogger’s internet reference of choice, Wikipedia, concerning the original PVI:
The Cook Partisan Voting Index (Cook PVI) is a measurement of how strongly a United States congressional district leans toward the Democratic or Republican Party, compared to the nation as a whole. The Cook Political Report introduced the PVI in August 1997 to better gauge the competitiveness of each district using the 1992 and 1996 presidential elections as a baseline
PVI uses the results of Presidential elections at the congressional district level to compute a baseline measure of how a district should be expected to vote. But PVI isn’t used to predict how a congressional district will vote for President, it is used to predict how a congressional district will vote for congress.
“Why not just look at the results of congressional elections in that district to predict congressional elections?” The short answer is, to be able to compare districts with one another using the same information. Since all congressional districts vote for the same people for President (as far as PVI is concerned), when you compare districts to one another an apples to apples comparison is being made. To continue the overused fruit analogy, comparing results of the actual congressional elections in different districts is akin to comparing apples to oranges because every different congressional election features different candidates and different dynamics.
“Okay, so what is hPVI?” The “h” stands for hybrid, and the PVI stands for the same thing as regular PVI, Partisan Voting Index. It’s a hybrid because while it is a very similar metric to PVI in spirit, it uses slightly different data and is calculated differently.
Before I explain how hPVI is calculated, let’s quote the venerable Wikipedia again on how PVI is calculated:
PVIs are calculated by comparing the district’s average Democratic or Republican Party’s share of the two-party presidential vote in the past two presidential elections to the nation’s average share of the same. The national average for 2004 and 2008 was 51.2% Democratic to 48.8% Republican. For example, in Alaska’s at-large congressional district, the Republican candidate won 63% and 61% of the two-party share in the 2004 and 2008 presidential elections, respectively. Comparing the average of these two results (62%) against the average national share (49%), this district has voted 13 percentage points more Republican than the country as a whole, or R+13.
While PVI uses the election results from the past two Presidential elections (2012 and 2008) to create it’s metric, hPVI uses the results from the last Presidential election (2012) and the last Gubernatorial election (2014). This change has two advantages; fresher data, and a set of data localized to the state level.
The other thing that differs between the two metrics is that PVI is calculated as the difference between how the district voted and how the country as a whole voted. hPVI is the difference between how the district voted and 50%. This is a more recent change (instituted the last time I did hPVI, in 2013), and was done to make hPVI more accurate for predicting the results of Minnesota legislative races.
For more information on the nitty-gritty, as well as the source code, see the GitHub repo.
The hPVI Histogram
The general shape of the hPVI histogram has been fairly constant over the time I’ve been publishing this metric. Like many states, Democrats in Minnesota are packed into the urban areas, while Republicans have spread themselves out all over. The result is the distributions you see below.
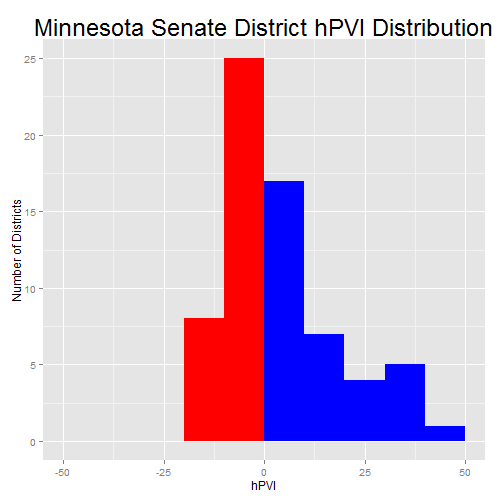
There are no districts that are greater than 15 points Republican, while there are 25 house and 12 senate districts that favor the DFL by greater than 15. On the flip side, there are 25 senate and 56 house districts which are between R+10 and EVEN, while there are 17 senate and 35 house districts between D+10 and EVEN.
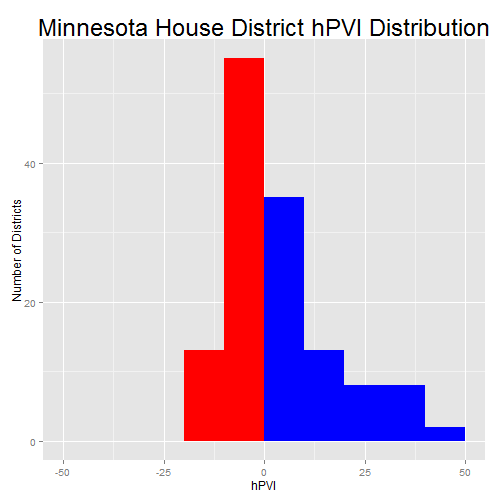
There are 19 house districts between R+2 and D+1, a Republican occupies all but one of those districts, which is why Republicans control the house right now. But because there are so many close districts, we could see the chamber yo-yo between parties for the rest of the decade if Democratic voters continue their habit of showing up in Presidential years but not in off-years.
The hPVI Table
| chamber | district | name | party | hpvi | rpvi | abs |
|---|---|---|---|---|---|---|
| Senate | 01 | LeRoy A. Stumpf | DFL | R+3 | -3.19 | 3.19 |
| Senate | 02 | Rod Skoe | DFL | R+4 | -3.78 | 3.78 |
| Senate | 03 | Thomas M. Bakk | DFL | D+10 | 10.01 | 10.01 |
| Senate | 04 | Kent Eken | DFL | D+3 | 3.37 | 3.37 |
| Senate | 05 | Tom Saxhaug | DFL | D+3 | 2.63 | 2.63 |
| Senate | 06 | David J. Tomassoni | DFL | D+15 | 14.68 | 14.68 |
| Senate | 07 | Roger J. Reinert | DFL | D+20 | 20.30 | 20.30 |
| Senate | 08 | Bill Ingebrigtsen | R | R+9 | -9.17 | 9.17 |
| Senate | 09 | Paul E. Gazelka | R | R+10 | -10.49 | 10.49 |
| Senate | 10 | Carrie Ruud | R | R+5 | -4.71 | 4.71 |
| Senate | 11 | Tony Lourey | DFL | D+6 | 6.26 | 6.26 |
| Senate | 12 | Torrey N. Westrom | R | R+6 | -6.41 | 6.41 |
| Senate | 13 | Michelle L. Fischbach | R | R+8 | -7.86 | 7.86 |
| Senate | 14 | John C. Pederson | R | D+1 | 1.36 | 1.36 |
| Senate | 15 | David M. Brown | R | R+11 | -10.57 | 10.57 |
| Senate | 16 | Gary H. Dahms | R | R+6 | -5.86 | 5.86 |
| Senate | 17 | Lyle Koenen | DFL | R+1 | -1.32 | 1.32 |
| Senate | 18 | Scott J. Newman | R | R+10 | -10.02 | 10.02 |
| Senate | 19 | Kathy Sheran | DFL | D+6 | 6.34 | 6.34 |
| Senate | 20 | Kevin L. Dahle | DFL | R+1 | -1.35 | 1.35 |
| Senate | 21 | Matt Schmit | DFL | R+3 | -2.65 | 2.65 |
| Senate | 22 | Bill Weber | R | R+6 | -6.36 | 6.36 |
| Senate | 23 | Julie A. Rosen | R | R+6 | -5.60 | 5.60 |
| Senate | 24 | Vicki Jensen | DFL | R+3 | -3.12 | 3.12 |
| Senate | 25 | David H. Senjem | R | R+1 | -1.30 | 1.30 |
| Senate | 26 | Carla J. Nelson | R | R+1 | -0.62 | 0.62 |
| Senate | 27 | Dan Sparks | DFL | D+6 | 6.17 | 6.17 |
| Senate | 28 | Jeremy R. Miller | R | D+4 | 3.50 | 3.50 |
| Senate | 29 | Bruce D. Anderson | R | R+10 | -10.47 | 10.47 |
| Senate | 30 | Mary Kiffmeyer | R | R+12 | -12.03 | 12.03 |
| Senate | 31 | Michelle R. Benson | R | R+13 | -12.77 | 12.77 |
| Senate | 32 | Sean R. Nienow | R | R+7 | -6.58 | 6.58 |
| Senate | 33 | David J. Osmek | R | R+10 | -10.39 | 10.39 |
| Senate | 34 | Warren Limmer | R | R+7 | -6.81 | 6.81 |
| Senate | 35 | Branden Petersen | R | R+7 | -6.77 | 6.77 |
| Senate | 36 | John A. Hoffman | DFL | D+1 | 0.88 | 0.88 |
| Senate | 37 | Alice M. Johnson | DFL | D+1 | 0.84 | 0.84 |
| Senate | 38 | Roger C. Chamberlain | R | R+5 | -4.70 | 4.70 |
| Senate | 39 | Karin Housley | R | R+3 | -3.05 | 3.05 |
| Senate | 40 | Chris A. Eaton | DFL | D+18 | 18.05 | 18.05 |
| Senate | 41 | Barb Goodwin | DFL | D+12 | 11.72 | 11.72 |
| Senate | 42 | Bev Scalze | DFL | D+5 | 5.10 | 5.10 |
| Senate | 43 | Charles W. Wiger | DFL | D+7 | 6.77 | 6.77 |
| Senate | 44 | Terri E. Bonoff | DFL | D+1 | 1.25 | 1.25 |
| Senate | 45 | Ann H. Rest | DFL | D+12 | 12.28 | 12.28 |
| Senate | 46 | Ron Latz | DFL | D+17 | 16.65 | 16.65 |
| Senate | 47 | Julianne E. Ortman | R | R+12 | -11.70 | 11.70 |
| Senate | 48 | David W. Hann | R | EVEN | -0.29 | 0.29 |
| Senate | 49 | Melisa Franzen | DFL | D+3 | 2.72 | 2.72 |
| Senate | 50 | Melissa H. Wiklund | DFL | D+11 | 10.60 | 10.60 |
| Senate | 51 | Jim Carlson | DFL | D+4 | 3.70 | 3.70 |
| Senate | 52 | James P. Metzen | DFL | D+6 | 5.74 | 5.74 |
| Senate | 53 | Susan Kent | DFL | D+1 | 1.44 | 1.44 |
| Senate | 54 | Katie Sieben | DFL | D+3 | 2.84 | 2.84 |
| Senate | 55 | Eric R. Pratt | R | R+9 | -8.71 | 8.71 |
| Senate | 56 | Dan D. Hall | R | R+2 | -2.10 | 2.10 |
| Senate | 57 | Greg D. Clausen | DFL | EVEN | -0.29 | 0.29 |
| Senate | 58 | Dave Thompson | R | R+8 | -7.64 | 7.64 |
| Senate | 59 | Bobby Joe Champion | DFL | D+33 | 33.00 | 33.00 |
| Senate | 60 | Kari Dziedzic | DFL | D+31 | 31.41 | 31.41 |
| Senate | 61 | D. Scott Dibble | DFL | D+31 | 30.62 | 30.62 |
| Senate | 62 | Jeff Hayden | DFL | D+40 | 40.17 | 40.17 |
| Senate | 63 | Patricia Torres Ray | DFL | D+31 | 31.08 | 31.08 |
| Senate | 64 | Richard Cohen | DFL | D+26 | 25.92 | 25.92 |
| Senate | 65 | Sandra L. Pappas | DFL | D+32 | 32.36 | 32.36 |
| Senate | 66 | John Marty | DFL | D+22 | 22.34 | 22.34 |
| Senate | 67 | Foung Hawj | DFL | D+25 | 25.05 | 25.05 |
| House | 01A | Dan Fabian | R | R+4 | -4.50 | 4.50 |
| House | 01B | Debra Kiel | R | R+2 | -1.79 | 1.79 |
| House | 02A | Dave Hancock | R | R+1 | -0.87 | 0.87 |
| House | 02B | Steve Green | R | R+7 | -6.76 | 6.76 |
| House | 03A | David Dill | DFL | D+9 | 8.64 | 8.64 |
| House | 03B | Mary Murphy | DFL | D+11 | 11.39 | 11.39 |
| House | 04A | Ben Lien | DFL | D+8 | 7.68 | 7.68 |
| House | 04B | Paul Marquart | DFL | R+1 | -0.54 | 0.54 |
| House | 05A | John Persell | DFL | D+3 | 3.14 | 3.14 |
| House | 05B | Tom Anzelc | DFL | D+2 | 2.12 | 2.12 |
| House | 06A | Carly Melin | DFL | D+16 | 15.85 | 15.85 |
| House | 06B | Jason Metsa | DFL | D+14 | 13.61 | 13.61 |
| House | 07A | Jennifer Schultz | DFL | D+19 | 19.38 | 19.38 |
| House | 07B | Erik Simonson | DFL | D+21 | 21.35 | 21.35 |
| House | 08A | Bud Nornes | R | R+9 | -9.50 | 9.50 |
| House | 08B | Mary Franson | R | R+9 | -8.85 | 8.85 |
| House | 09A | Mark Anderson | R | R+11 | -10.88 | 10.88 |
| House | 09B | Ron Kresha | R | R+10 | -10.11 | 10.11 |
| House | 10A | Josh Heintzeman | R | R+6 | -6.22 | 6.22 |
| House | 10B | Dale Lueck | R | R+3 | -3.34 | 3.34 |
| House | 11A | Mike Sundin | DFL | D+13 | 13.36 | 13.36 |
| House | 11B | Jason Rarick | R | R+1 | -1.49 | 1.49 |
| House | 12A | Jeff Backer | R | R+1 | -1.30 | 1.30 |
| House | 12B | Paul Anderson | R | R+12 | -12.05 | 12.05 |
| House | 13A | Jeff Howe | R | R+8 | -7.54 | 7.54 |
| House | 13B | Tim O'Driscoll | R | R+8 | -8.18 | 8.18 |
| House | 14A | Tama Theis | R | R+1 | -1.24 | 1.24 |
| House | 14B | Jim Knoblach | R | D+4 | 4.29 | 4.29 |
| House | 15A | Sondra Erickson | R | R+7 | -6.70 | 6.70 |
| House | 15B | Jim Newberger | R | R+14 | -14.13 | 14.13 |
| House | 16A | Chris Swedzinski | R | R+3 | -3.16 | 3.16 |
| House | 16B | Paul Torkelson | R | R+9 | -8.51 | 8.51 |
| House | 17A | Tim Miller | R | R+1 | -1.12 | 1.12 |
| House | 17B | Dave Baker | R | R+2 | -1.51 | 1.51 |
| House | 18A | Dean Urdahl | R | R+9 | -8.76 | 8.76 |
| House | 18B | Glenn Gruenhagen | R | R+11 | -11.35 | 11.35 |
| House | 19A | Clark Johnson | DFL | D+4 | 4.17 | 4.17 |
| House | 19B | John Considine Jr. | DFL | D+9 | 8.81 | 8.81 |
| House | 20A | Bob Vogel | R | R+9 | -8.99 | 8.99 |
| House | 20B | David Bly | DFL | D+6 | 5.99 | 5.99 |
| House | 21A | Tim Kelly | R | D+1 | 1.22 | 1.22 |
| House | 21B | Steve Drazkowski | R | R+7 | -6.68 | 6.68 |
| House | 22A | Joe Schomacker | R | R+8 | -7.83 | 7.83 |
| House | 22B | Rod Hamilton | R | R+5 | -4.64 | 4.64 |
| House | 23A | Bob Gunther | R | R+10 | -9.58 | 9.58 |
| House | 23B | Tony Cornish | R | R+1 | -1.45 | 1.45 |
| House | 24A | John Petersburg | R | R+4 | -4.05 | 4.05 |
| House | 24B | Brian Daniels | R | R+2 | -2.09 | 2.09 |
| House | 25A | Duane Quam | R | R+6 | -5.71 | 5.71 |
| House | 25B | Kim Norton | DFL | D+3 | 3.12 | 3.12 |
| House | 26A | Tina Liebling | DFL | D+8 | 7.69 | 7.69 |
| House | 26B | Nels Pierson | R | R+7 | -6.93 | 6.93 |
| House | 27A | Peggy Bennett | R | D+5 | 4.93 | 4.93 |
| House | 27B | Jeanne Poppe | DFL | D+8 | 7.58 | 7.58 |
| House | 28A | Gene Pelowski Jr. | DFL | D+7 | 6.62 | 6.62 |
| House | 28B | Greg Davids | R | D+1 | 0.88 | 0.88 |
| House | 29A | Joe McDonald | R | R+12 | -11.76 | 11.76 |
| House | 29B | Marion O'Neill | R | R+9 | -9.04 | 9.04 |
| House | 30A | Nick Zerwas | R | R+10 | -10.16 | 10.16 |
| House | 30B | Eric Lucero | R | R+14 | -13.88 | 13.88 |
| House | 31A | Kurt Daudt | R | R+14 | -14.23 | 14.23 |
| House | 31B | Tom Hackbarth | R | R+11 | -11.43 | 11.43 |
| House | 32A | Brian Johnson | R | R+7 | -7.13 | 7.13 |
| House | 32B | Bob Barrett | R | R+6 | -6.07 | 6.07 |
| House | 33A | Jerry Hertaus | R | R+14 | -14.00 | 14.00 |
| House | 33B | Cindy Pugh | R | R+7 | -6.72 | 6.72 |
| House | 34A | Joyce Peppin | R | R+10 | -9.97 | 9.97 |
| House | 34B | Dennis Smith | R | R+4 | -3.75 | 3.75 |
| House | 35A | Abigail Whelan | R | R+4 | -4.36 | 4.36 |
| House | 35B | Peggy Scott | R | R+9 | -8.86 | 8.86 |
| House | 36A | Mark Uglem | R | R+2 | -1.51 | 1.51 |
| House | 36B | Melissa Hortman | DFL | D+3 | 3.21 | 3.21 |
| House | 37A | Jerry Newton | DFL | D+4 | 3.81 | 3.81 |
| House | 37B | Tim Sanders | R | R+2 | -2.00 | 2.00 |
| House | 38A | Linda Runbeck | R | R+6 | -5.56 | 5.56 |
| House | 38B | Matt Dean | R | R+4 | -3.93 | 3.93 |
| House | 39A | Bob Dettmer | R | R+4 | -4.37 | 4.37 |
| House | 39B | Kathy Lohmer | R | R+2 | -1.74 | 1.74 |
| House | 40A | Michael V. Nelson | DFL | D+18 | 18.15 | 18.15 |
| House | 40B | Debra Hilstrom | DFL | D+18 | 17.95 | 17.95 |
| House | 41A | Connie Bernardy | DFL | D+10 | 9.87 | 9.87 |
| House | 41B | Carolyn Laine | DFL | D+14 | 13.52 | 13.52 |
| House | 42A | Barb Yarusso | DFL | D+3 | 2.83 | 2.83 |
| House | 42B | Jason Isaacson | DFL | D+7 | 7.37 | 7.37 |
| House | 43A | Peter Fischer | DFL | D+6 | 6.39 | 6.39 |
| House | 43B | Leon Lillie | DFL | D+7 | 7.18 | 7.18 |
| House | 44A | Sarah Anderson | R | R+3 | -2.57 | 2.57 |
| House | 44B | Jon Applebaum | DFL | D+5 | 4.81 | 4.81 |
| House | 45A | Lyndon Carlson Sr. | DFL | D+9 | 9.43 | 9.43 |
| House | 45B | Mike Freiberg | DFL | D+15 | 14.83 | 14.83 |
| House | 46A | Ryan Winkler | DFL | D+16 | 15.68 | 15.68 |
| House | 46B | Cheryl Youakim | DFL | D+18 | 17.76 | 17.76 |
| House | 47A | Jim Nash | R | R+14 | -14.37 | 14.37 |
| House | 47B | Joe Hoppe | R | R+9 | -8.94 | 8.94 |
| House | 48A | Yvonne Selcer | DFL | D+3 | 2.52 | 2.52 |
| House | 48B | Jenifer Loon | R | R+4 | -3.54 | 3.54 |
| House | 49A | Ron Erhardt | DFL | D+2 | 2.37 | 2.37 |
| House | 49B | Paul Rosenthal | DFL | D+3 | 3.07 | 3.07 |
| House | 50A | Linda Slocum | DFL | D+14 | 14.39 | 14.39 |
| House | 50B | Ann Lenczewski | DFL | D+7 | 7.36 | 7.36 |
| House | 51A | Sandra Masin | DFL | D+5 | 5.40 | 5.40 |
| House | 51B | Laurie Halverson | DFL | D+2 | 2.19 | 2.19 |
| House | 52A | Rick Hansen | DFL | D+9 | 8.78 | 8.78 |
| House | 52B | Joe Atkins | DFL | D+3 | 2.53 | 2.53 |
| House | 53A | JoAnn Ward | DFL | D+7 | 6.74 | 6.74 |
| House | 53B | Kelly Fenton | R | R+4 | -3.57 | 3.57 |
| House | 54A | Dan Schoen | DFL | D+6 | 6.25 | 6.25 |
| House | 54B | Denny McNamara | R | EVEN | -0.27 | 0.27 |
| House | 55A | Bob Loonan | R | R+4 | -4.17 | 4.17 |
| House | 55B | Tony Albright | R | R+12 | -12.31 | 12.31 |
| House | 56A | Drew Christensen | R | R+3 | -3.13 | 3.13 |
| House | 56B | Roz Peterson | R | R+1 | -1.13 | 1.13 |
| House | 57A | Tara Mack | R | D+1 | 0.84 | 0.84 |
| House | 57B | Anna Wills | R | R+1 | -1.34 | 1.34 |
| House | 58A | Jon Koznick | R | R+8 | -7.77 | 7.77 |
| House | 58B | Pat Garofalo | R | R+7 | -7.50 | 7.50 |
| House | 59A | Joe Mullery | DFL | D+34 | 34.25 | 34.25 |
| House | 59B | Raymond Dehn | DFL | D+32 | 31.92 | 31.92 |
| House | 60A | Diane Loeffler | DFL | D+31 | 31.45 | 31.45 |
| House | 60B | Phyllis Kahn | DFL | D+31 | 31.41 | 31.41 |
| House | 61A | Frank Hornstein | DFL | D+31 | 30.87 | 30.87 |
| House | 61B | Paul Thissen | DFL | D+30 | 30.37 | 30.37 |
| House | 62A | Karen Clark | DFL | D+40 | 40.19 | 40.19 |
| House | 62B | Susan Allen | DFL | D+40 | 40.12 | 40.12 |
| House | 63A | Jim Davnie | DFL | D+36 | 36.08 | 36.08 |
| House | 63B | Jean Wagenius | DFL | D+26 | 25.96 | 25.96 |
| House | 64A | Erin Murphy | DFL | D+30 | 29.96 | 29.96 |
| House | 64B | Dave Pinto | DFL | D+22 | 22.24 | 22.24 |
| House | 65A | Rena Moran | DFL | D+35 | 35.49 | 35.49 |
| House | 65B | Carlos Mariani | DFL | D+30 | 29.60 | 29.60 |
| House | 66A | Alice Hausman | DFL | D+18 | 17.63 | 17.63 |
| House | 66B | John Lesch | DFL | D+30 | 29.88 | 29.88 |
| House | 67A | Tim Mahoney | DFL | D+25 | 25.43 | 25.43 |
| House | 67B | Sheldon Johnson | DFL | D+25 | 24.70 | 24.70 |
Thanks for your feedback. If we like what you have to say, it may appear in a future post of reader reactions.