


Projecting the Minnesota House
Since the Republicans took back the Minnesota House following the 2010 elections, control has oscillated between the parties. This being a Presidential year that oscillation is set to return the House to DFL control. But that conclusion doesn’t seem to be the one shared by the local punditry, most of whom have concluded that the Minnesota House is likely to stay with the Republicans. Some have even suggested that, maybe, the State Senate could be in play for the Republicans.
The problem with either of these possibilities, the Republicans taking the State Senate and holding the State House; is that, as I’ve mentioned already this is a Presidential year. If recent election history in Minnesota is any guide, in Presidential years local races just don’t move the needle that much. The only thing that really matters is what happens at the top of the ticket.
Observe:
| Year | Democrat | Republican | Difference | House DFL | House GOP | Difference | Pres – House |
| 2004 | 51.1% | 47.6% | 3.5% | 52.3% | 47.8% | 4.5% | -1.0% |
| 2008 | 54.1% | 43.8% | 10.2% | 55.6% | 44.4% | 11.2% | -1.0% |
| 2012 | 52.7% | 45.0% | 7.7% | 54.4% | 45.7% | 8.7% | -1.0% |
Let’s go through these numbers; the first column should be obvious, the second through fourth columns are Presidential election results in Minnesota with the difference being the Democrats vote share minus the Republicans vote share. The fifth through seventh columns are Minnesota House results (two-party results), all the DFL candidates totals added up and all the Republicans totals added up and the difference between the two.
The eighth column though is the one I’m concerned with. That is the difference between the Presidential margin and the House margin. Do you notice anything about that column that stands out? Like how the number has been exactly the same the last three elections? Like these two sets of results are somehow linked?
The sample size is only three elections, so if you want to poke a hole in this whole theory, that’s your best bet, not a big enough sample size to draw conclusions from. I could have included the 2000 election in the data set after all and didn’t. What happened in 2000? Al Gore beat George W Bush 47.9% to 45.5%, a 2.4% difference while the House Republicans beat the House Democrats 52.9% to 47.1%, a 5.8% difference in favor of the Republicans.
I didn’t go back that far for a couple of reasons; 1) that was two redistricting cycles ago and 2) that would totally screw up the eighth column of the above table.
This idea, that local races don’t matter at all in Presidential years is not a popular one, it makes political professionals all sorts of worried, but it’s essentially The Truth. And it’s the theory under which the remainder of this post is operating.
To project the overall House margin then, all that is needed is a projection for the Presidential race. This can be obtained from any of the vast array of sources online that do state by state Presidential election projections. The one I am using for this exercise is the one from fivethrityeight.com. Currently (as of 10am on 11/2) 538 has Hillary Clinton winning Minnesota 49.4% to 43.9%, a difference of 5.5%. Using the trend from the above table, we would expect the House Democrats to get 6.5% more of the total House vote than House Republicans.
Okay, that’s nice, but what does a 6.5% margin mean when it comes to seats? That’s what matters after all, not which party gets the most votes in the aggregate, but which party wins the most seats.
It turns out you can make decently accurate predictions about the final seat distribution if all you know is the aggregate margin; observe:
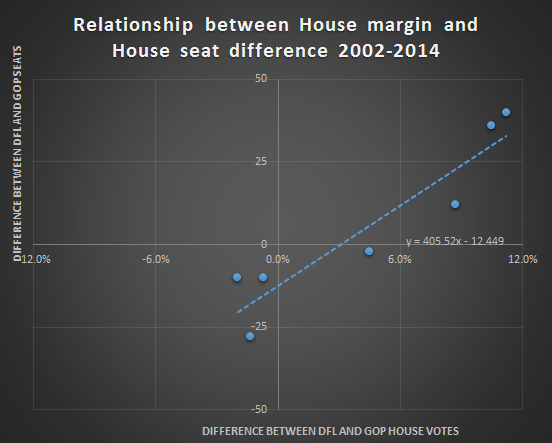
The seat error from the above regression line ranges from 11 to 5, with the average absolute error being just over 8 seats.
Using the above regression line and the 538 Presidential results projection, an estimated seat distribution can now be calculated:
| 538 forecast | House forecast | Seat projection |
| 5.5% | 6.5% | 14 |
This, admittedly very crude, model projects that the DFL will control the house by a 14 seat margin as a result of this election.
There is reason to be skeptical of that 14 seat number, besides the error inherent in the model. For the two elections this regression line covers with the current House districts, it is on the high side both times; in 2012 it indicates a 23 seat DFL advantage, they actually ended up with a 12 seat advantage and in 2014 it shows a 15 seat GOP advantage, while they ended up with a 10 seat advantage.
To account for this I’ll simply cut the projection in half and say, if the final Presidential margin is what 538 is currently projecting, the DFL will control the Minnesota House by a 7 seat margin when the election is over.
Below is a table with the seat projections for various Presidential results possibilities:
| President | House | Seats |
| 10% | 11% | 32 |
| 8% | 9% | 24 |
| 5% | 6% | 12 |
| 4% | 5% | 8 |
| 3% | 4% | 4 |
| 2% | 3% | 0 |
| 1% | 2% | -4 |
UPDATE
I received the following comment from Mac Hall in regards to this post:
Hi Tony,
Your analysis sure looks good on the periphery, but how do you account for the closeness / blowout factor ? And incumbency ? The non-participation factor in down ballot races ? The non-Clinton/Trump vote ?My gut tells me that by looking at the total numbers may be misleading … as some Districts will have blowout wins while others are super-competitive. What I have noticed (and I haven’t looked at in years, but it seemed that in non-Presidential years, the MNGOP gets the same number of votes winning some close districts yet when it is a presidential year, more DFLers show up.)
A quick test would be to look at the top ten most competitive House contests and compare that outcome to the Presidential contest.Also, the power of incumbency can be a factor that allows a Republicans to do well even when the district supports a Democrat presidential candidate.
Lastly, this ya gotta wonder how many people will be voting for third party candidates … admittedly, I don’t expect Peter J Borowitz of The Unicorn Party to get many votes — even though he is from Spring Lake Park MN but I would not be surprised to see Evan McMullin, Gary Johnson and Jill Stein to do well.
Lastly, have you reviewed the legislature versus other contests for a similar trend … for example, in 2014, the DFL candidates won the US Senate and all State offices … but MNGOP took the House. Considering that Franken won by 10points, Dayton won by 5points, and Simon had the closest race winning by just over a point … should that have meant that the DFL should have at least held more seats rather than losing (was in ten seats?)
These are all good questions and the simple answer is that this is a crude way of looking at the House. Every race will have it’s own factors, incumbency, money, third parties, that further influence the results of that race. To get down to that level though would require doing actual individual race ratings. I’ve done those in the past and they are exceptionally time consuming to do correctly.
That said, the relationship between the Presidential numbers and the House vote is fairly strong and in Presidential years it just doesn’t seem to matter all that much what these local House candidates do, the top-of-the-ticket is what is driving all the turnout.
Thanks for your feedback. If we like what you have to say, it may appear in a future post of reader reactions.