

The graph that Daudt and Hahn cannot comprehend
Pretty self explanatory, but it’s a picture Daudt and Hahn cannot quite comprehend.
From the office of MN Budget Management
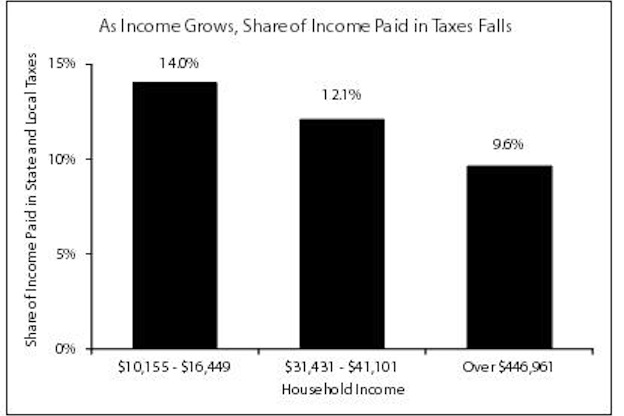
As Income Grows, the share of income paid in taxes falls
The wealthiest one percent of Minnesotans (those with household incomes over $446,961) paid 9.6 percent of their incomes in total state and local taxes in 2010. This is significantly less than the 12.1 percent paid by a middle-income household making $31,431 to $41,101.[1]

Since 1990, tax fairness in Minnesota has declined.[2] Two factors help explain the growing gap. One is rising income inequality. In other words, the benefits of economic growth have gone disproportionately to those with the highest incomes.[3]
But policy choices are also part of the picture, including the shift in the mix of taxes. Minnesota today relies less on state taxes and more on local property taxes, which are based on home value and not as closely linked to someone’s ability to pay. In 2006, local taxes made up 26.4 percent of total state and local taxes in Minnesota.[4] They increased to 30.8 percent of total taxes in 2010.
_______________________________________________________
The reader may wonder how this came to pass. Who would promote this type of inequitable tax situation? The short answer should come from a review of the Pawlenty years. Pawlenty of course is now in the 9.6% bracket. Could it be this is why MN has come to budget woes? The GOP via its TBaalParty just worships this type of scenario and they definitely are pushing for more relief at the top. It’s a pretty picture to them and they want to gild this lily at the first possible chance.
Selling a pig in poke to its constituency is where the GOP really excels.
Vote GOP in 2014 and improve this picture, or NOT!
Thanks for your feedback. If we like what you have to say, it may appear in a future post of reader reactions.