

Sources of error in polls, part 2
This is part two, as you may be able to tell from the title, of a two part series on error in political polls. In part one I went over the fundamental assumptions that go into political polling and talked about phase one, the sample phase, and how it is effected by both random and biased error.
In this post I will talk about the actual data collection phase, wherein that sample is put to use and the names or households contained within it are contacted and potentially turned into respondents.
This part of the process, the calling of people and asking them questions, is, as you might have guessed, also subject to error, as we will see below.
The Data Collection Process
One you have the sample in hand the individuals/households who make up the sample need to be contacted and surveyed. And since this post is operating under a theme, that theme being sources of error, there are a multitude of ways in which error, or the potential for error, can effect the data collection phase.
Making Contact
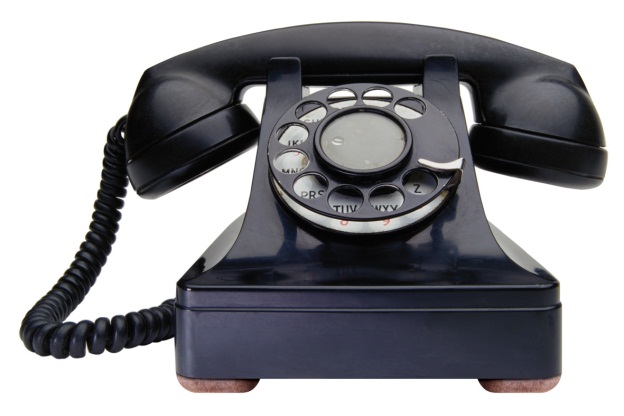
Because of the fractured and evolving nature of communications right now, this is the part of the polling industry that is in the most flux.
Many pollsters continue to poll the way they always have, by employing people to actually make calls and interview potential respondents. Most of these pollsters have adapted by including cell phones in their samples, and it doesn’t much change their methodology in this regard.
Among pollsters who regularly poll Minnesota the StarTribune poll is an example of a live interviewer poll.
Other pollsters though, in an effort to provide cheaper and more efficient solutions for their clients have adopted an automated calling model, in which the survey questions are recorded and then a computer asks the recorded questions to the respondents.
Some of the pollsters who use this method and operate in Minnesota are SurveyUSA and Public Policy Polling (PPP).
One of the big issues for automated polling companies is what to do about cell phone only households, since it’s against federal law to call cellphones with an automated polling system.
PPP, for instance, doesn’t make an effort to include these people in their polls, while SurveyUSA, in some instances, has live interviewers call the cell phone part of the sample and still uses the automated system for the landline interviews.
A few pollsters have even begun using the internet to conduct their polls, or use the internet as part of a hybrid model that also includes either automated or in-person calling.
All of these different methods present a different experience to the person being polled, and therefore potentially can lead to bias error.
There is evidence, for example, that respondents will answer issue questions differently if they are talking with an actual person as opposed to being interviewed by a computer.
Another example of this type of thing would be the internal polls conducted by the Harry Reid campaign in Nevada in 2010. These polls consistently showed the Majority Leader with a stable 5-6 point lead over his opponent. Most public polls of the race however showed a slight Sharron Angle advantage.
It turns out that Harry Reid’s internal polling was on the money. One of the things that Harry Reid’s pollster did was to make sure that the group of people doing the actual surveying somewhat matched the group of people being surveyed.
What this means is that you don’t want the make-up of your call group to significantly differ from your sample population, you want roughly similar gender distributions, similar age and race distributions, etc.
If, for instance, you have a group of interviewers that is all male, they may receive different responses from female respondents than a female interviewer would.
As it turns out, this might have been part of the problem with the last Humphrey Institute poll of the governor’s race in 2010:
Jacobs and Miller wonder whether the proportion of African-American poll-takers — 44 percent — might’ve freaked out (presumably white) voters in a state that’s only 5 percent black.
The article goes on to say that Jacobs and Miller don’t think this was a problem (why would they?) but that Frank Newport, the guy doing the independent audit, thinks that this could be directly related to the high amount of 612 conversions that skewed the numbers.
Because some people will simply not want to be polled, or may be resistant to being polled, if there is something about what you are doing to try to convert those people into being respondents that leads to systemic differences in conversion rates among sub-groups of the population, you can get funny results.
Other considerations are the particular procedures used to identify who the respondent is once you have contacted a household. Just talking to the first person who answers the phone is not the most robust method, because if that person always answers the phone than other members of that household would not have the same chance to be selected.
Ideally there would be a selection routine of some kind, asking to speak to the person with the next birthday or similar method, to try and randomize the respondent selection. The goal is that every potential respondent should have an equal shot of being talked to.
Often data cannot be collected from a respondent, but as long as these non-responses are random, they shouldn’t bias the results of the poll. The degree to which they are concentrated among certain elements of the population though, will add a level of bias to the results.
Some pollsters will make multiple attempts to contact and convert respondents, others will try once and move on. As with most things involving political polling, the more you try to control error, the more the survey will cost.
The Survey
Once contact is made with a respondent the actual polling can begin. And in case you didn’t know where this was going already, the questions being asked can themselves be a source of error.
In horse race polling this isn’t usually the case, as the question is rather straightforward, “If the election for [insert office here] were held today would you vote for [candidate a, the democrat] or [candidate b, the republican] (rotate).”
Where question wording can be a problem is when you get into issue questions. The exact phrasing of the question can have a large impact on the responses people give. If a question is too long or convoluted people will likely forget aspects of the question or get confused.
If, on the other hand, the question is too simplistic, you may not get the data from it that you wanted. And example of this can be found with the polling around the legacy amendment, as it’s come to be known, which was on the ballot in Minnesota in 2008.
In the lead up to the vote on the amendment both sides were claiming that the polling showed their side winning and you can see the differences in how question wording effected the results from just single pollster, the Humphrey Institute Poll.
In August they published a poll that purported to show the amendment losing badly, 72%-22%.
The problem? They didn’t ask people how they were going to vote on the actual amendment, instead they asked about how people feel about where taxes should come from to pay for certain things… or something.
In October they decided to ask people how they were going to actually vote on the amendment itself, and shockingly (not really), the results were dramatically different, with the amendment leading 46%-36%.
The Data Itself
Once the data has been collected the actual polling is done, but that is when the data manipulation begins. This is the phase of the process where the pollster will attempt to correct for sample error and otherwise massage the data into a more reasonable form.
The Likely Voter Screen
One of the things that pollsters will sometimes do is to apply a likely voter screen. Most pollsters have their own closely guarded way in which they do this, but in the end it involves making decisions about who is more likely to vote based on some piece of data that is either external to the poll or part of the poll itself.
During the 2010 election SurveyUSA came under fire from a number of bloggers for their likely voter screen which identified what SUSA called “uniquely motivated” voters. These were voters who hadn’t shown any particular propensity to vote in prior elections, but that they nonetheless identified as likely voters.
As it turns out SurveyUSA had it right, Nate Silver identified them as one of the most accurate pollsters of that cycle despite, or maybe because of, the fact that they were one of the most prolific. Not only that but a substantial amount of their polling was of congressional races which are historically and actually more difficult to poll than statewide races.
Weighting
Weighting of sub-samples is used to help account for random sampling error and bring a sample distribution into closer alignment with the actual population distribution.
An example of a random error would be that your sample is 54% male and the population you are surveying is actually 48% male. Assuming that the sample was acquired through random means, this would be an example of random error and is something that would get adjusted through weighting.
While weighting is commonly done by gender and age and race, immutable characteristics of a population, some pollsters have experimented with other types of weighting.
Going back to the MPR/Humphrey poll of the 2010 governor’s race, one thing they didn’t do was call cell phones as a part of the poll. Instead, they weighted the land-line respondents they talked to who also had cell phones in an attempt to correct for the issue.
Suffice it to say, this is not a technique without its critics, one of them being Jay Leve of SurveyUSA:
There is no defensible weighting that can be done to a universe of reachable respondents [landliners] to compensate for a universe of unreachable respondents [CPOs]. There is a 50% chance that weighting, in an attempt to compensate for respondents who had zero chance of being included, will make the data worse, not better.
And this all goes back to money. Calling cell phone only households costs more money. The sample costs more, the data collection costs more, and so the desire to not call cell phone only households and instead “weight them in” is strong.
Another controversial weighting technique is to weight partisan ID’s in an attempt to match the expected partisan make-up of the electorate. All pollsters will weight for things like age, sex and race, but this information is readily available and reliable. Peoples race and sex don’t change and their age progresses in a linear fashion.
Partisan ID however is fluid and always changing within the population, so to make assumptions about what the partisan makeup of the electorate will be is viewed skeptically by many in the polling industry. Additionally, the only way to get baseline information on partisan ID of voters is through exit polling, which itself can be subject to a large degree of error.
That said, if you are polling on a budget and cutting a lot of corners in the sample and interview process, it might be beneficial to try and massage your data into a more realistic form.
Said differently, if the data itself is crap, it doesn’t really hurt to adjust it in similarly crappy ways. Garbage in, garbage out, as the saying goes, so it isn’t going to hurt the garbage if you dress it up a little.
Conclusion
The conclusion is simple, polling is a business filled with uncertainties and possibilities for error.
This is especially so for media polls, where often times the cost of the poll is the prime driver of it’s effectiveness. Campaigns are more interested in getting good results and are usually willing to pay more for them, but even then, there’s a lot that can go wrong.
In a way, a pollsters job is similar to a doctors in that rule number one is do no harm to the data. The easiest way to do no harm is to just let random processes drive everything. But randomness itself is messy and by it’s very definition, sometimes inaccurate.
You will often hear margin of error quoted in reference to a poll, but this just refers to a single aspect of potential error, the random sampling error. There are many other areas in which error and bias can seep into a poll though, and the margin of error doesn’t account for any of these.
This is not to say that the margin of error is meaningless, just that I care a lot more about who conducted the poll and how it was conducted than I do about whether they talked to 500 rather than 1,000 people.
Thanks for your feedback. If we like what you have to say, it may appear in a future post of reader reactions.