by Tony Petrangelo
Jun 6, 2013, 9:00 AM
A Brief History of Ideology in the Minnesota Legislature
Last week I took a look at a new metric that attempts to measure the relative Ideology of state Legislatures and Legislators. Called “np_score” and developed by Boris Shor and Nolan McCarty (their website is at Measuring American Legislatures) the metric ranges from roughly -2 (very liberal) to +2 (very conservative).
This metric is derived from roll call votes cast by legislators and the score represents the votes for the legislator’s entire career for which the metric covers (the Minnesota data spans 1995 to 2008). This is different from DW-Nominate, which assigns United States Congress People scores on a session by session basis.
As I teased in that last post, the point of this post is to examine the relationship Minnesota Legislators Ideology scores have with hPVI, the metric that I developed to measure the partisan lean of state legislative districts.
Said differently, to what degree does a district’s partisan lean inform our understanding of how the representative of that district is likely to vote on legislation?
Below is a scatterplot of the np_scores of all Minnesota’s legislators between 2003 and 2008, against the average hPVI score of that legislator’s district. I’m using the 2003 to 2008 range because I don’t have hPVI numbers for districts prior to 2003 and the np_score dataset doesn’t have any Minnesota data from after 2008.
np_score typically runs negative for liberal, positive for conservative, but since hPVI runs on the opposite scale I’m using the inverse of np_score in the graph below.
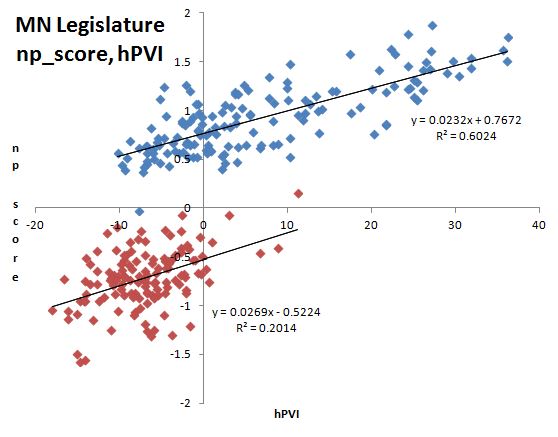
It’s not hard to see the differences between the two parties, even without the regression lines. A DFLer in a district with an hPVI of EVEN would be expected to have an ideology score of -.77, while a GOPer representing the same district would be expected to have an ideology score of .52.
What’s interesting though is that the slopes are almost identical, meaning that the amount of ideological change that can be expected as you move along the hPVI spectrum is about the same in each party. Yet the strengths of the correlations are dramatically different.
There is a further distinction when broken down by legislative chamber. Below are two scatterplots, the first the House only, the second for the Senate only:
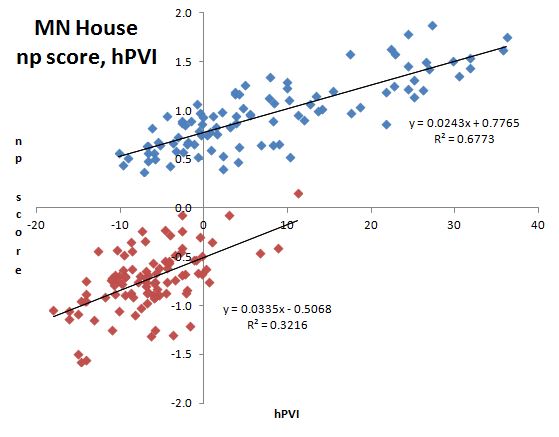
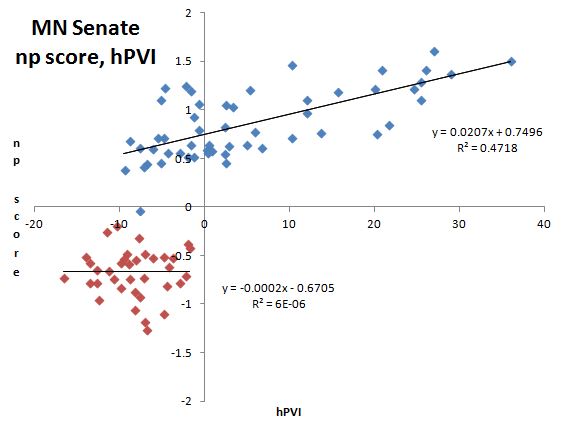
On the DFL side the slope is similar for the Senate and the House, while on the GOP side they are very different. In fact, Republican Senators ideology scores exhibited zero relationship with hPVI, a bit of a startling result.
Overall the correlation between np_score and hPVI is stronger for DFLers then for Republicans and stronger in the House then in the Senate. Let’s look at these two issues separately.
First off, why might DFLers ideology scores correlate with hPVI more strongly than Republicans, and is this a feature or a bug? So to speak.
The answer to the why part of the question may have something to do with the fact that Republican legislators occupied only slightly less space on the ideology scale then their DFL counterparts, while at the same time occupying considerably much less space on the hPVI scale than the DFL.
Over the period this data covers the GOP has an np_score range 91% the size of the DFLs, yet the GOP has an hPVI range 63% the size of the DFLs. The DFL, as a party, has a lot more room along the hPVI spectrum to work with while the GOP is almost entirely confined to the lower side of the graph.
Another explanation: DFL legislators are more apt to “vote their district” than Republican legislators are. If that’s the case, the obvious follow-up question is whether that is a good thing or a bad thing.
As far as the differences between the House and Senate, those only really manifest themselves within the GOP. The House Republican’s slope is actually the largest of the four groups and yet Senate Republicans voting Ideology could not be explained one bit by hPVI.
In this regard the anomalous group are Senate Republicans.
Look at the difference between their scatter plot and that of the House Republicans. Not only is the Senate GOP located entirely within the lower left quadrant, but they even have a buffer along the x and y axis.
The Senate GOP was in the minority for the entire time frame that this data covers, and that could affect the numbers for the Republican Senators.
If there is one take away from this analysis, it’s that the votes of Minnesota DFLers in the legislature tend to reflect the ideological views of their constituents more reliably then the votes of Minnesota Republicans do.
—
This is a comment I received from Jim in regards to part one of this series:
Thanks for your discussion of the Shor et al. model. Quantifying ideology is a tough and inexact slog. I’m not sure I buy into the rather nebulous “bridge actor” comparisons (especially when they are sparse and result in numerical scores with four significant digits), but it seems like a fair first approximation.
I do have some concerns with the MN data set. Some legislators are listed multiple times without context For instance, Rep Abeler is scored as 0.46, 0.354, and -0.05. I’m betting his score has been decreasing over the years – he is probably a delegate [candidate?] for the least ideological/most independent legislator in the MN House.
Minor question: Did you flip the np_score axis? Looking at the raw data set for MN pols, shouldn’t Democrats be mostly in the (-) range and Republicans in the (+)?
As it concerns the Minnesota data set I have been in touch with Dr. Shor about these issues and he said they will be addressed in the next release of the data.
There seem to be two separate issues with the Minnesota data, as far as I have seen, one is the one you identified where a single legislator is represented multiple times. In some cases this is justified by the metrics methodology, which is to create separate scores for a legislator when they switch parties or districts.
But some of these duplicates were not happening for that reason. There appears to have been a coding error in the house district names for the 2007-2008 legislative sessions and so there is a separate entry from every house member serving those years.
In the case of Jim Abler, there are three rows where there should only be two; one is for 1999-2002, before the last redistricting cycle, one is for 2003-2006 and one is for 2007-2008, which should be combined with 2003-2006. And yes, Rep. Abler’s np_score has indeed decreased over the years.
The second issue with the data that I found was that a couple Senators, Tarryl Clark and Jim Carlson, appear to have had their scores combined with those of house members of the same last name, Karen Clark and Lyndon Carlson.
About the second issue I did nothing. It impacted only two data points out of over two hundred, so I just left those numbers alone.
About the first issue I did this. I used a weighted average of the legislator’s np_score with the number of legislative sessions the score represents serving as the weight. So in the case of Jim Abler again, I would ignore the score from before 2003, and for the other two I would average them, giving the 2003-2006 score a weight of four and the 2007-2008 score a weight of two.
And as it concerns the last question, I answered that in this post, but yes, I used the inverse of the np_score in the graphs so that negative and positive meant the same thing as hPVI. I could have used the inverse of hPVI just the same.
Thanks for your feedback. If we like what you have to say, it may appear in a future post of reader reactions.

A Brief History of Ideology in the Minnesota Legislature
Last week I took a look at a new metric that attempts to measure the relative Ideology of state Legislatures and Legislators. Called “np_score” and developed by Boris Shor and Nolan McCarty (their website is at Measuring American Legislatures) the metric ranges from roughly -2 (very liberal) to +2 (very conservative).
This metric is derived from roll call votes cast by legislators and the score represents the votes for the legislator’s entire career for which the metric covers (the Minnesota data spans 1995 to 2008). This is different from DW-Nominate, which assigns United States Congress People scores on a session by session basis.
As I teased in that last post, the point of this post is to examine the relationship Minnesota Legislators Ideology scores have with hPVI, the metric that I developed to measure the partisan lean of state legislative districts.
Said differently, to what degree does a district’s partisan lean inform our understanding of how the representative of that district is likely to vote on legislation?
Below is a scatterplot of the np_scores of all Minnesota’s legislators between 2003 and 2008, against the average hPVI score of that legislator’s district. I’m using the 2003 to 2008 range because I don’t have hPVI numbers for districts prior to 2003 and the np_score dataset doesn’t have any Minnesota data from after 2008.
np_score typically runs negative for liberal, positive for conservative, but since hPVI runs on the opposite scale I’m using the inverse of np_score in the graph below.
It’s not hard to see the differences between the two parties, even without the regression lines. A DFLer in a district with an hPVI of EVEN would be expected to have an ideology score of -.77, while a GOPer representing the same district would be expected to have an ideology score of .52.
What’s interesting though is that the slopes are almost identical, meaning that the amount of ideological change that can be expected as you move along the hPVI spectrum is about the same in each party. Yet the strengths of the correlations are dramatically different.
There is a further distinction when broken down by legislative chamber. Below are two scatterplots, the first the House only, the second for the Senate only:
On the DFL side the slope is similar for the Senate and the House, while on the GOP side they are very different. In fact, Republican Senators ideology scores exhibited zero relationship with hPVI, a bit of a startling result.
Overall the correlation between np_score and hPVI is stronger for DFLers then for Republicans and stronger in the House then in the Senate. Let’s look at these two issues separately.
First off, why might DFLers ideology scores correlate with hPVI more strongly than Republicans, and is this a feature or a bug? So to speak.
The answer to the why part of the question may have something to do with the fact that Republican legislators occupied only slightly less space on the ideology scale then their DFL counterparts, while at the same time occupying considerably much less space on the hPVI scale than the DFL.
Over the period this data covers the GOP has an np_score range 91% the size of the DFLs, yet the GOP has an hPVI range 63% the size of the DFLs. The DFL, as a party, has a lot more room along the hPVI spectrum to work with while the GOP is almost entirely confined to the lower side of the graph.
Another explanation: DFL legislators are more apt to “vote their district” than Republican legislators are. If that’s the case, the obvious follow-up question is whether that is a good thing or a bad thing.
As far as the differences between the House and Senate, those only really manifest themselves within the GOP. The House Republican’s slope is actually the largest of the four groups and yet Senate Republicans voting Ideology could not be explained one bit by hPVI.
In this regard the anomalous group are Senate Republicans.
Look at the difference between their scatter plot and that of the House Republicans. Not only is the Senate GOP located entirely within the lower left quadrant, but they even have a buffer along the x and y axis.
The Senate GOP was in the minority for the entire time frame that this data covers, and that could affect the numbers for the Republican Senators.
If there is one take away from this analysis, it’s that the votes of Minnesota DFLers in the legislature tend to reflect the ideological views of their constituents more reliably then the votes of Minnesota Republicans do.
—
This is a comment I received from Jim in regards to part one of this series:
As it concerns the Minnesota data set I have been in touch with Dr. Shor about these issues and he said they will be addressed in the next release of the data.
There seem to be two separate issues with the Minnesota data, as far as I have seen, one is the one you identified where a single legislator is represented multiple times. In some cases this is justified by the metrics methodology, which is to create separate scores for a legislator when they switch parties or districts.
But some of these duplicates were not happening for that reason. There appears to have been a coding error in the house district names for the 2007-2008 legislative sessions and so there is a separate entry from every house member serving those years.
In the case of Jim Abler, there are three rows where there should only be two; one is for 1999-2002, before the last redistricting cycle, one is for 2003-2006 and one is for 2007-2008, which should be combined with 2003-2006. And yes, Rep. Abler’s np_score has indeed decreased over the years.
The second issue with the data that I found was that a couple Senators, Tarryl Clark and Jim Carlson, appear to have had their scores combined with those of house members of the same last name, Karen Clark and Lyndon Carlson.
About the second issue I did nothing. It impacted only two data points out of over two hundred, so I just left those numbers alone.
About the first issue I did this. I used a weighted average of the legislator’s np_score with the number of legislative sessions the score represents serving as the weight. So in the case of Jim Abler again, I would ignore the score from before 2003, and for the other two I would average them, giving the 2003-2006 score a weight of four and the 2007-2008 score a weight of two.
And as it concerns the last question, I answered that in this post, but yes, I used the inverse of the np_score in the graphs so that negative and positive meant the same thing as hPVI. I could have used the inverse of hPVI just the same.
Thanks for your feedback. If we like what you have to say, it may appear in a future post of reader reactions.