

hPVI 2021, Senate edition
It’s once again that time, the most anticipated event of the Minnesota political calendar, the bi-annual—covid rules edition—release of hPVI, Minnesota’s Oldest And Most Beloved Legislative District Metric™. If you’re unfamiliar with hPVI, here is an explainer I did for the 2017 edition. Short version, hPVI combines the results of the last Presidential and Gubernatorial elections in a legislative district into a composite result, which is the district’s hPVI.
Most of the partisan numbers you will see cited about the new districts are the last presidential race results, but hPVI has twice as many inputs, making it twice as good. That’s how math works.
Senate hPVI Histogram
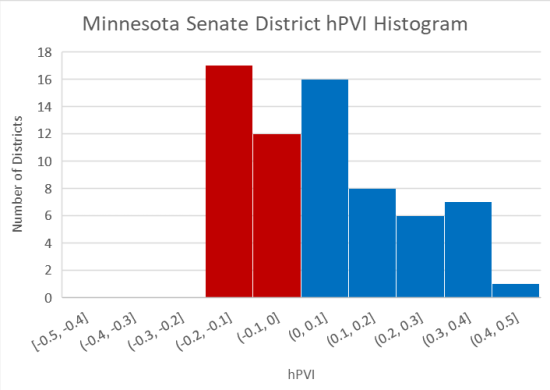
This isn’t too far from the general shape of the histogram from the last round of hPVI in the old districts.
| Year | > R+20 | R+20 – R+11 | R+10 – Even | Even – D+10 | D+11 – D+20 | > D+20 | Total GOP | Total DFL |
|---|---|---|---|---|---|---|---|---|
| 2021 | 0 | 17 | 12 | 16 | 8 | 14 | 30 | 37 |
| 2019 | 2 | 15 | 16 | 16 | 7 | 11 | 33 | 34 |
| 2017 | 0 | 16 | 21 | 15 | 5 | 10 | 37 | 30 |
While the general shape has stayed the same, what you can see in the table above is that the GOP has been bleeding marginal districts to the DFL for the past few cycles. Compared to 2017, the DFL has added seven districts that are considered safe (>D+10), while the GOP has added one safe district. What’s more, while the DFL has gained a district that leans its way, the GOP has shed nine such districts.
While this breakdown gives an overall view of the distribution of districts, the majority of the action will not come in the D+9 or R+12 districts. It will come in the D+2 and R+1 districts. The following table shows the probability of a party winning a seat based on hPVI alone, and as you can see, it’s not until you get to hPVI numbers below five that districts begin to look competitive.
| hPVI Edge | Win Probability |
|---|---|
| 12 | 99% |
| 10 | 97% |
| 7 | 90% |
| 5 | 80% |
| 3 | 70% |
| 2 | 65% |
| 1 | 55% |
A common way that political analysts rate districts is on a safe/likely/lean continuum, and the same labels can be applied to hPVI scores. An hPVI of 10 or more would be safe, an hPVI of between 5 and 10 would be likely, an hPVI or between 2 and 5 would be a leaner, and an hPVI less than two would be a toss-up. If we use those buckets for the new Senate districts, this is how they shake out.
| Safe GOP | Likely GOP | Lean GOP | Toss-up | Lean DFL | Likely DFL | Safe DFL |
|---|---|---|---|---|---|---|
| 17 | 2 | 4 | 12 | 4 | 6 | 22 |
| 23 | 12 | 32 | ||||
If the DFL can win all of the districts that they *should*, they only need to win two of the 12 toss-ups to achieve a Senate majority. While this seems like an excellent redistricting result for the DFL, let’s look at what the numbers would look like under the old map.
| Safe GOP | Likely GOP | Lean GOP | Toss-up | Lean DFL | Likely DFL | Safe DFL |
|---|---|---|---|---|---|---|
| 17 | 2 | 8 | 6 | 6 | 6 | 22 |
| 27 | 6 | 34 | ||||
Under the old map, hPVI had the DFL favored to win the majority without any toss-up seats needed. But there are half as many toss-ups under the old map, and while the DFL would pick up two additional seats in which they would be favored, the GOP adds four.
Other then being a bit more competitive, the old and new maps are pretty similar in the aggregate, even if Edinites might not think so.
The Toss-ups
Here are 12 districts that fall into the toss-up category.
| District | Incumbent* | Party | hPVI |
|---|---|---|---|
| 4 | Kent Eken | DFL | Even |
| 7 | Open | D+1 | |
| 14 | Aric Putnam | DFL | D+2 |
| 24 | Carla Nelson | GOP | EVEN |
| 26 | Jeremy Miller | GOP | EVEN |
| 32 | Open | EVEN | |
| 33 | Open | EVEN | |
| 37 | Warren Limmer | GOP | D+1 |
| 41 | Open | D+2 | |
| 48 | Julia Coleman | GOP | R+1 |
| 54 | Karla Bigham | DFL | R+2 |
| 58 | Open | R+1 |
* Since these are new districts, you can make a case that no one is an incumbent.
Of the 12 toss-ups, three have a DFL incumbent, four a GOP incumbent, and the remaining five are open. If both parties win all the non-toss-up seats, though, as mentioned earlier, the DFL only needs to win two out of the above 12 districts to achieve a majority. The obvious problem with that math is that the upcoming election will be the first midterm under a new President, which historically is terrible news for that party. The current President’s party is the same as the DFL, even if they have different names. From a recent historical perspective, the DFL winning the majority this cycle would be a minor miracle.
Beyond the headwinds presented by the political environment itself, the current iteration of hPVI is likely to be overly optimistic of the DFLs chances in general. Below is a graph of the DFL statewide composite used in the hPVI calculations over the last four cycles.
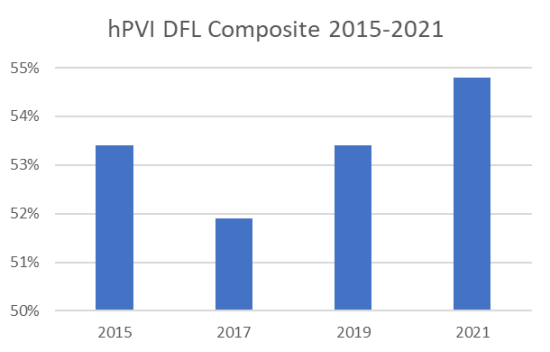
To explain more fully, each bar is the average of the DFL’s share of the two-party vote in the previous Presidential and Gubernatorial elections. So 2015 is the DFLs two-party average for the 2012 Presidential and the 2014 Gubernatorial elections. 2017 is the DFLs two-party average for the 2014 Gubernatorial and 2016 Presidential elections. As the above graph ably demonstrates, 2021 was a high-water mark for the DFL two-party average.
It’s these two-party composite averages that make up hPVI, and the 2021 version of the two-party average is the highest it’s been for the DFL in a long time. All of which is to say, if these numbers seem a bit bullish for the DFL, that’s because they probably are.
Below is the complete table of districts. I didn’t include any information about incumbents because much is still up in the air. Instead, each district has a region label (arbitrarily defined by me) and some of the cities in the district.
Senate hPVI Table
rPVI = raw hPVI
| District | rPVI | hPVI | Region | Citie(s) |
|---|---|---|---|---|
| 1 | -0.132 | R+13 | North West | East Grand Forks, Roseau, Thief River Falls |
| 2 | -0.044 | R+4 | North Central | Bagley, Baudette, Bemidji |
| 3 | 0.028 | D+3 | North East | Ely, Grand Marais, Two Harbors |
| 4 | -0.005 | EVEN | North West | Detroit Lakes, Moorhead |
| 5 | -0.186 | R+19 | Central Central | Long Prairie, Park Rapids, Wadena |
| 6 | -0.105 | R+10 | Central Central | Baxter, Brainerd, Grand Rapids |
| 7 | 0.007 | D+1 | North East | Eveleth, Hibbing, Virginia |
| 8 | 0.210 | D+21 | North East | Duluth |
| 9 | -0.144 | R+14 | Central West | Fergus Falls, Perham, Wheaton |
| 10 | -0.199 | R+20 | Central Central | Aitkin, Little Falls |
| 11 | -0.044 | R+4 | Central East | Carlton, Cloquet, Moose Lake |
| 12 | -0.141 | R+14 | Central West | Alexandria, Benson, Morris |
| 13 | -0.142 | R+14 | Central Central | Sartell, Sauk Rapids, St. Joseph |
| 14 | 0.018 | D+2 | Central Central | St. Cloud |
| 15 | -0.122 | R+12 | South West | Madison, New Ulm, Redwood Falls |
| 16 | -0.121 | R+12 | Central Central | Litchfield, Renville, Willmar |
| 17 | -0.163 | R+16 | Central Central | Hutchinson, Gaylord |
| 18 | 0.091 | D+9 | South Central | Mankato, North Mankato |
| 19 | -0.081 | R+8 | South Central | Owatonna, Waseca |
| 20 | -0.068 | R+7 | South East | Marion, Red Wing, Wabasha |
| 21 | -0.132 | R+13 | South West | Luverne, Windom, Worthington |
| 22 | -0.111 | R+11 | South Central | Blue Earth, Fairmont |
| 23 | -0.033 | R+3 | South Central | Albert Lea, Austin |
| 24 | -0.004 | EVEN | South East | Mantorville, Rochester |
| 25 | 0.107 | D+11 | South East | Rochester |
| 26 | 0.001 | EVEN | South East | La Crescent, Spring Valley, Winona |
| 27 | -0.188 | R+19 | Central Central | Big Lake, Princeton, Zimmerman |
| 28 | -0.130 | R+13 | Central East | Cambridge, Isanti, Lindstrom |
| 29 | -0.132 | R+13 | Central Central | Buffalo, Delano, Monticello |
| 30 | -0.125 | R+13 | Central Central | Elk River, Otsego, St. Michael |
| 31 | -0.113 | R+11 | Metro | Andover, East Bethel, Ramsey |
| 32 | -0.003 | EVEN | Metro | Blaine, Columbus, Ham Lake |
| 33 | 0.005 | EVEN | Metro | Forest Lake, Hugo, Stillwater |
| 34 | 0.049 | D+5 | Metro | Brooklyn Park, Champlin, Rogers |
| 35 | 0.025 | D+2 | Metro | Andover, Anoka, Coon Rapids |
| 36 | 0.043 | D+4 | Metro | Lino Lakes, Vadnais Heights, White Bear Lake |
| 37 | 0.012 | D+1 | Metro | Corcoran, Maple Grove, Medina |
| 38 | 0.210 | D+21 | Metro | Brooklyn Center, Brooklyn Park |
| 39 | 0.185 | D+18 | Metro | Columbia Heights, Fridley, New Brighton |
| 40 | 0.145 | D+15 | Metro | Mounds View, Roseville, Shoreview |
| 41 | 0.015 | D+2 | Metro | Cottage Grove, Hastings, Lake Elmo |
| 42 | 0.102 | D+10 | Metro | Maple Grove, Plymouth |
| 43 | 0.209 | D+21 | Metro | Crystal, Golden Valley, New Hope |
| 44 | 0.121 | D+12 | Metro | Maplewood, North St. Paul, Oakdale |
| 45 | 0.059 | D+6 | Metro | Minnetonka, Minnetrista, Orono |
| 46 | 0.236 | D+24 | Metro | Edina, Hopkins, St. Louis Park |
| 47 | 0.096 | D+10 | Metro | Maplewood, Woodbury |
| 48 | -0.011 | R+1 | Metro | Chanhassen, Chaska, Waconia |
| 49 | 0.115 | D+12 | Metro | Eden Prairie, Minnetonka |
| 50 | 0.150 | D+15 | Metro | Bloomington, Edina |
| 51 | 0.202 | D+20 | Metro | Bloomington, Minneapolis, Richfield |
| 52 | 0.128 | D+13 | Metro | Burnsville, Eagan, Mendota Heights |
| 53 | 0.093 | D+9 | Metro | Cottage Grove, Inver Grove Heights, South St. Paul |
| 54 | -0.019 | R+2 | Metro | Jordan, Prior Lake, Shakopee |
| 55 | 0.075 | D+8 | Metro | Burnsville, Savage |
| 56 | 0.082 | D+8 | Metro | Apple Valley, Eagan, Rosemount |
| 57 | -0.042 | R+4 | Metro | Elko, Lakeville |
| 58 | -0.006 | R+1 | Metro | Farmington, New Prague, Northfield |
| 59 | 0.357 | D+36 | Metro | Minneapolis |
| 60 | 0.375 | D+37 | Metro | Minneapolis |
| 61 | 0.375 | D+38 | Metro | Minneapolis |
| 62 | 0.426 | D+43 | Metro | Minneapolis |
| 63 | 0.379 | D+38 | Metro | Minneapolis |
| 64 | 0.331 | D+33 | Metro | St. Paul |
| 65 | 0.312 | D+31 | Metro | St. Paul, West St. Paul |
| 66 | 0.319 | D+32 | Metro | Falcon Heights, Roseville, St. Paul |
| 67 | 0.259 | D+26 | Metro | St. Paul |
Thanks for your feedback. If we like what you have to say, it may appear in a future post of reader reactions.