Fun with Graphs of Money
With all the fundraising reports now safely filed away we can get a little dangerous and make some graphs with the information!
I’m talking pie charts and bar graphs people, clearly you don’t want to miss this.
First up, some pie charts!
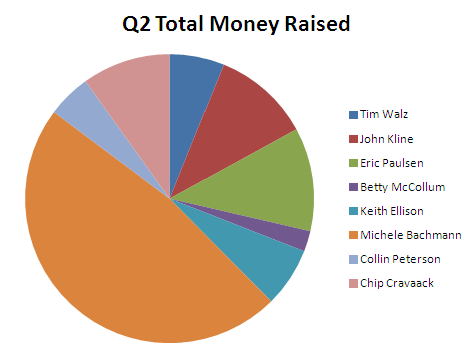
The above charts the total money raised in quarter two by the eight incumbent Minnesota house members. As you may or may not be aware, and as this chart helps to illustrate, Michele Bachmann is in a completely different fundraising league from the rest of the Minnesota delegation.
Despite all of her perceived problems; a failed presidential bid that had left her campaign starting in debt and a serial tendency to relay whatever crazy new nonsense she’s heard from some random person, she is still raking in the cash.
This only makes Jim Graves task, already difficult to begin with, all the more challenging. Much of the chatter about Michele Bachmann’s possible vulnerability this year, centered around the theory that her presidential bid damaged her brand and that would in turn dampen her fundraising for her house seat.
And while she’s not raising money like she was in 2010, she’s certainly raising more than enough money for a Minnesota sixth congressional district race.
And it’s coming in from individuals, as you can see in the pie chart below.
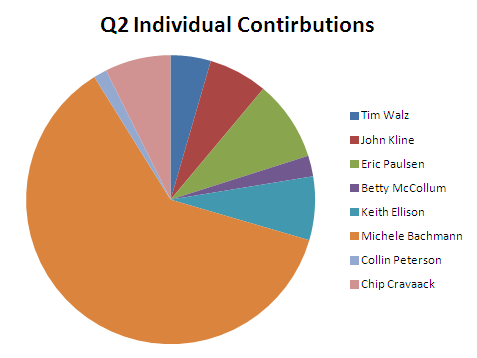
The majority of Bachmann’s individual contributions, about $1.2m worth, were unitemized, meaning they were less than $200. And these donors can be hit up again and again until election day.
Just the itemized money that she raised, $650,000, is more than twice as much as any of the other incumbents.
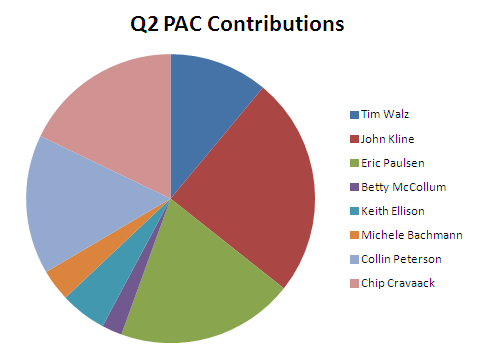
This is the first graph not dominated by Rep. Bachmann, it’s instead dominated her Republican colleagues in the state; John Kline, Eric Paulsen and Chip Cravaack.
Also with not small chunks, Tim Walz and Collin Peterson. Bachmann is actually second to last (and in this category, many would see that as a good thing), ahead of only Betty McCollum, in PAC money raised.
Now were going to switch gears a bit, and move onto bar graphs!
The first bar graph shows how much of a candidates total fundraising for the quarter came from individual contributions.
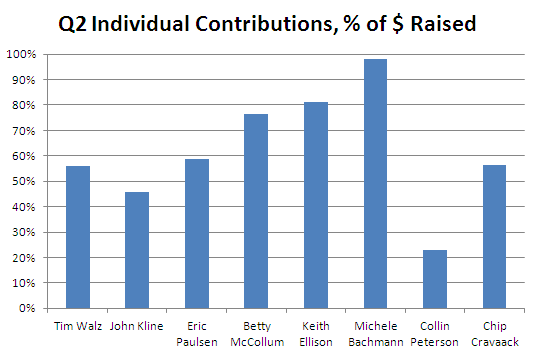
There are roughly three different buckets here; those who’s individual contribution percentage was well above 50% (Bachmann, Ellison, McCollum), those who were right around 50% (Walz, Kline, Paulsen, Cravaack) and Collin Peterson.
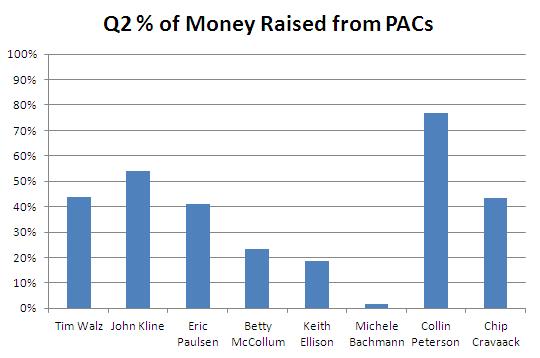
This is just the inverse of the above graph (since none of the incumbents loaned or contributed money to their campaigns, all of their receipts come from Individuals and PACs).
Finally, second quarter burn rate (disbursements divided by receipts).
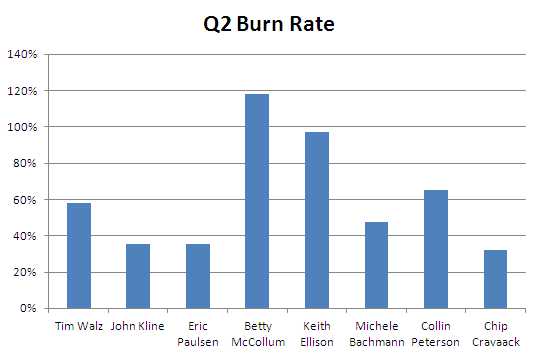
Most of the states incumbents have only burned about 50% of their receipts this quarter, while two, Keith Ellison and Betty McCollum have burned through quite a bit more.
Thanks for your feedback. If we like what you have to say, it may appear in a future post of reader reactions.


